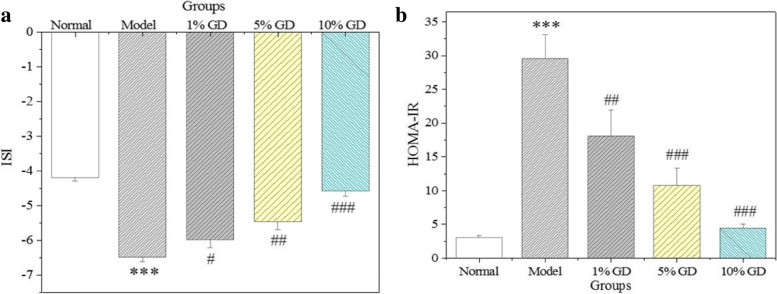
Fig. 7.
Effects of GD on ISI (a) and HOMA-IR (b). 1% GD, 1% GD-treated diabetic group; 5% GD, 5% GD-treated diabetic group; 10% GD, 10% GD-treated diabetic group. The experimental data are presented as means ± SD. ***P < 0.01, versus normal group; #P < 0.05, ##p < 0.01 and ###p < 0. 001, respectively, versus diabetic model group

