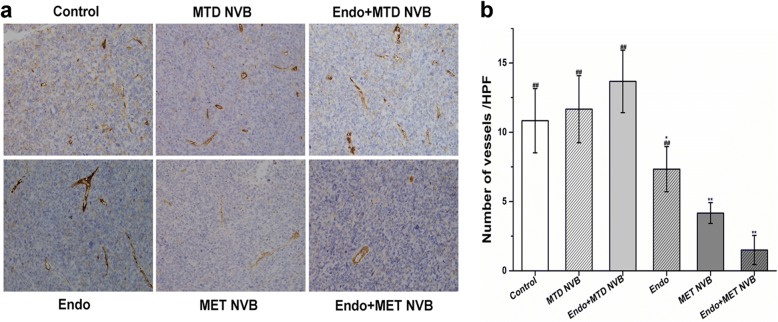
Fig. 3.
a Immunohistochemical images showing CD31 expression changes in tumor tissue in different treatment groups. b Quantitative analysis of CD31 expression in tumor tissue of xenograft mice in different groups. Data are expressed as the mean ± SD. *P < 0.05, **P < 0.01 versus the control group; #P < 0.05, ##P < 0.01 versus the MET NVB + Endo group. Original magnification, × 400

