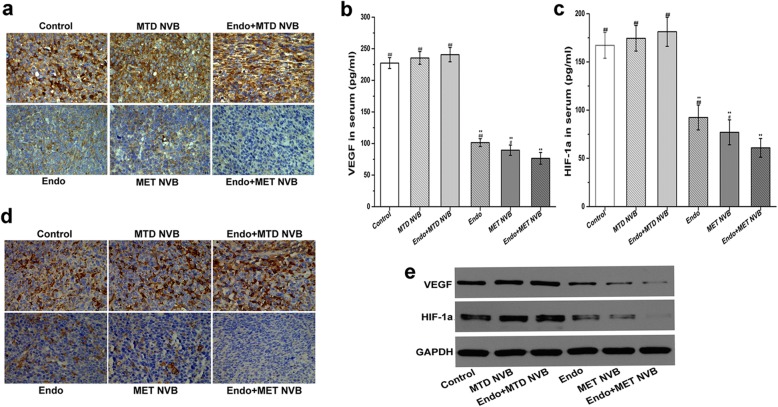
Fig. 4.
a Immunohistochemical analysis showing expression of VEGF in different treatment groups. b, c Serum levels of VEGF and HIF-1α determined by ELISA assay in different treatment groups. d Representative images of immunohistochemical analysis showing expression of HIF-1α in different treatment groups. e Expression of VEGF and HIF-1α was determined by Western blot analysis. GAPDH served as the loading control. Data are presented as the mean ± SD. *P < 0.05, **P < 0.01 versus the control group; #P < 0.05, ##P < 0.01 versus the MET NVB+ Endo group

