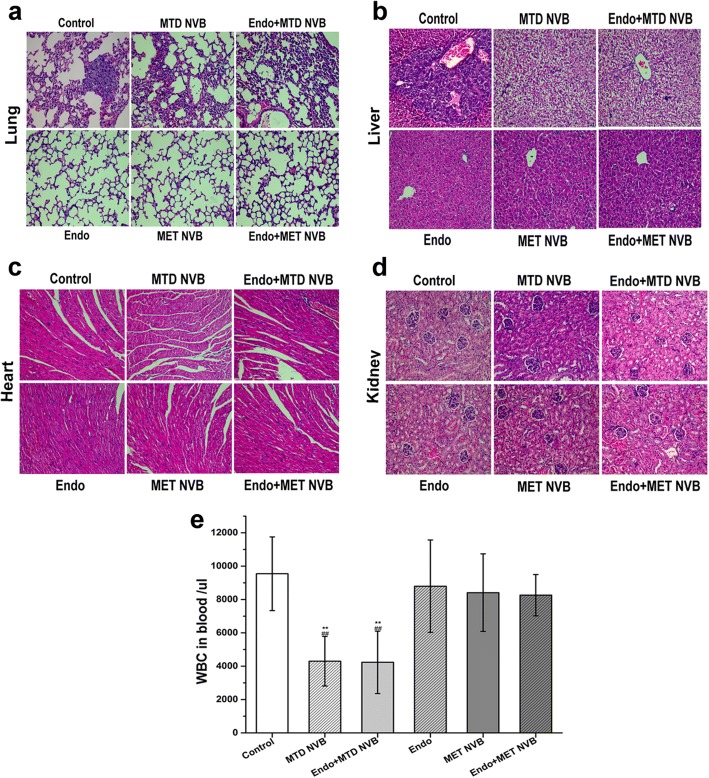
Fig. 6.
Evaluation of side effects. a H&E-stained lung sections of each treatment group (Original magnification, 200). b H&E-stained liver sections of each treatment group (Original magnification, 200). c H&E-stained heart sections of each treatment group (Original magnification, 200). d H&E-stained kidney sections of each treatment group (Original magnification, 200). e Treatment effects on white blood cell (WBC) counts after one full day of treatment. Data are presented as the mean ± SD. *P < 0.05, **P < 0.01 versus the control group; #P < 0.05, ##P < 0.01 versus the MET NVB+ Endo group

