Fig. 5.
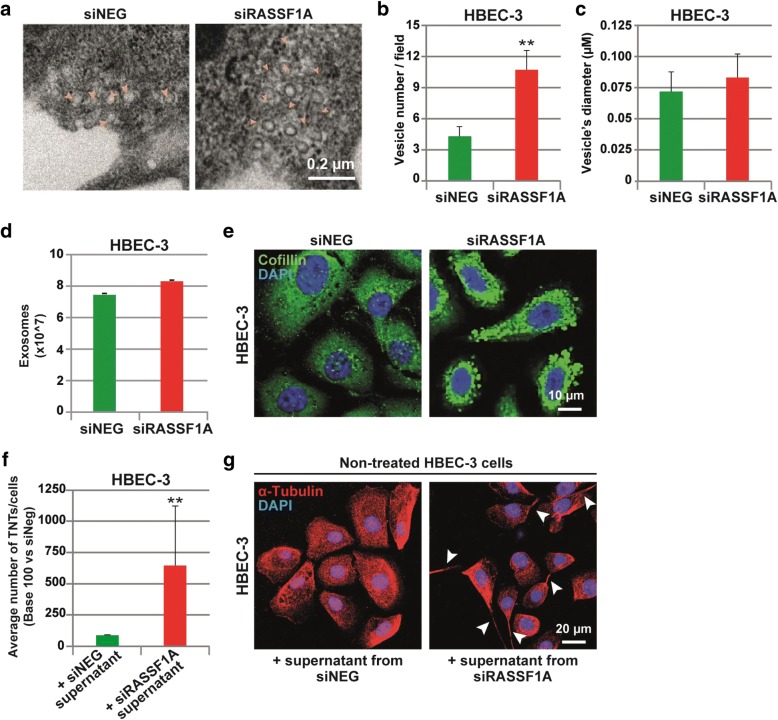
Exosomes released by RASSF1A depleted cells affect TNT formation. a Representative images and b–c quantification of cytoplasmic vesicles number and diameter (μm) by electron microscopy in HBEC-3 cells after transfection with control or RASSF1A RNAi. The vesicles are show with yellow arrowheads. d Quantification of the exosome release in control and RASSF1A knockdown HBEC-3 cells. e Representative images of cofilin staining in cells transfected with RNAi as indicated. f Quantification and g representative images of the TNT formation in non-treated HBEC-3 cells incubated with supernatant obtained from siNEG or siRASSF1A treated cells during 24 h. The TNTs are show with arrowheads. Values are the mean ± SEM of three independent experiments in approximately 200 cells. Statistical significance was calculated and p value are indicated by asterisks: **p < 0.01

