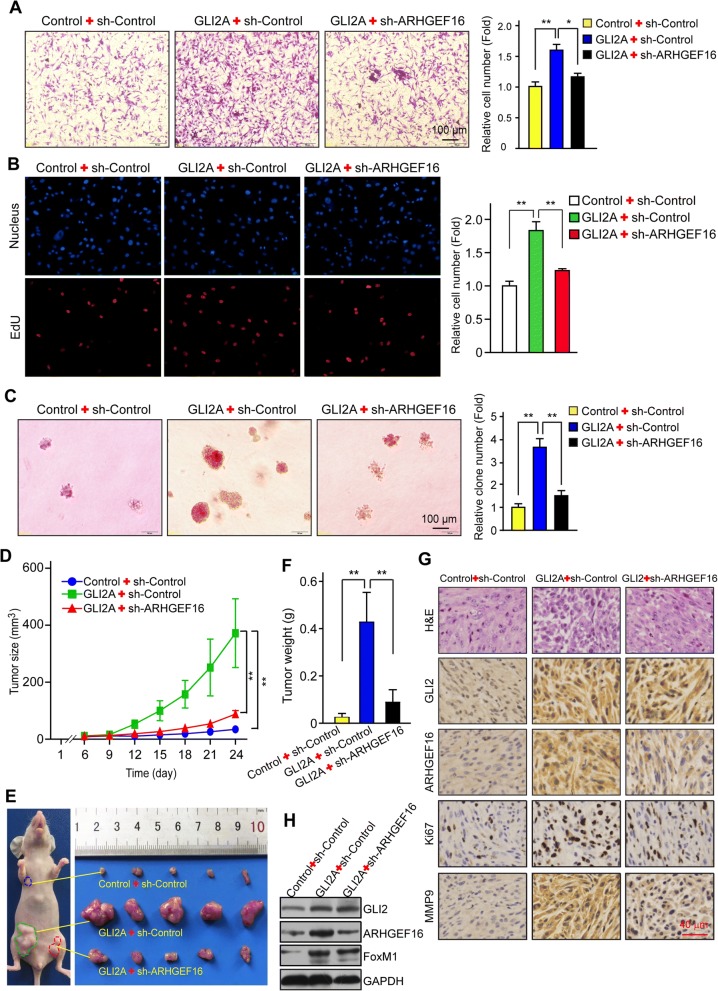
Fig. 5.
GLI2/ARHGEF16 signaling promotes glioma progression. a-c Migration (a) and proliferation (b, c) in Control+sh-Control, GLI2A + sh-Control and GLI2A + sh-ARHGEF16 U87 cells were compared with the transwell migration, EdU and soft-agar colony formation assays, respectively. n = 3, *, P < 0.05; **, P < 0.01. d Growth curves of xenografts formed by the indicated U87 cells in nude mice. n = 5, **, P < 0.01. e Image of the indicated glioma xenografts. f Weight of the indicated glioma xenograft tumors. n = 5, **, P < 0.01. g Hematoxylin and eosin staining of tumor tissues samples from indicated groups and detection of GLI2, ARHGEF16, Ki76, and MMP9 protein levels by immunohistochemistry. h The decreased ARHGEF16 protein level in U87 GLI2A + sh-ARHGEF16 xenografts compared to U87 GLI2A + sh-Control xenografts

