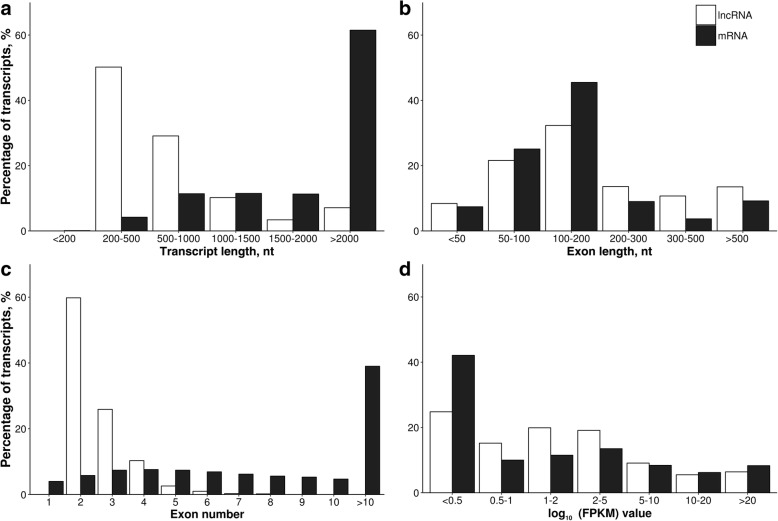
Fig. 2.
The percentage distribution of the identified lncRNAs and mRNAs according to their (a) transcript length, (b) exon length, (c) exon number and (d) expression level (the latter expressed as fragments per kilobase of exon per million fragments mapped [FPKM] values). The assumed nucleotide (nt) ranges as well as ranges of FPKM values are depicted in the X axis

