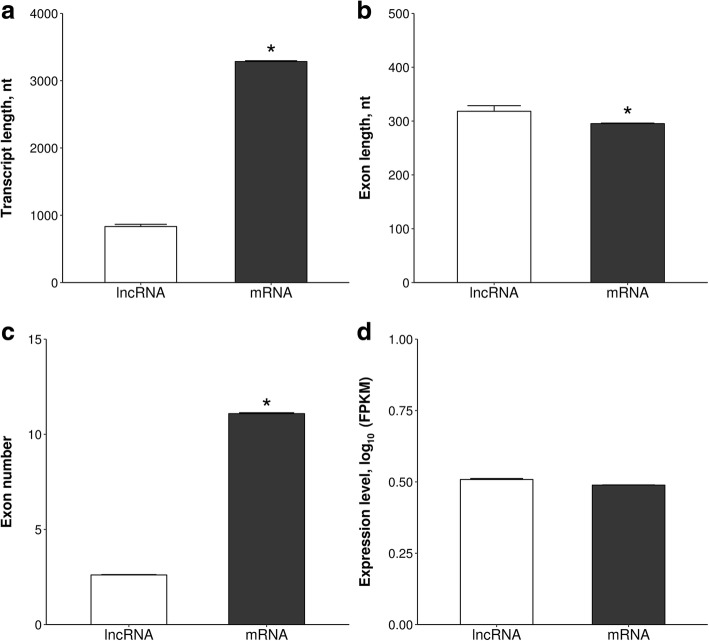
Fig. 3.
The comparison of genomic features of the identified lncRNAs and mRNAs. The lncRNAs and mRNAs were compared in respect to average (a) transcript length, (b) exon length, (c) exon number and (d) expression level. Data are expressed as mean ± SE. Statistical analysis was performed using Welch’s t-test in R package. Asterisks designate statistical differences (P < 0.05)

