Figure 2.

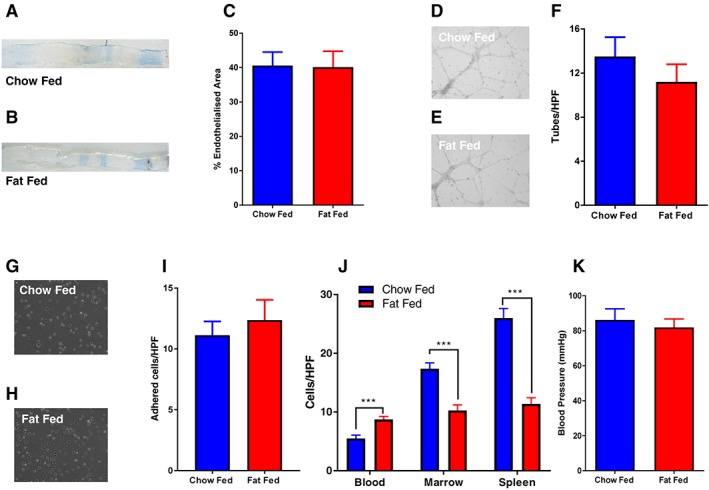
Endothelial regeneration remains preserved in mice with diet‐induced obesity at 3 months. A and B, Representative in situ Evans blue staining 7 d after vascular injury (blue staining indicates denuded endothelium). C, Endothelial regeneration 7 d after vascular injury was no different in fat‐fed mice when compared with chow‐fed controls (40.2 ± 4.6% vs. 40.6 ± 3.9%) N = 6 per group. D and E, Representative images of human umbilical vein endothelial cell (HUVEC) tube formation on matrigel after addition of conditioned media from MACs. F, There was no difference in tube formation of HUVEC exposed to conditioned media from myeloid angiogenic cells (MACs) from fat‐fed mice compared with chow‐fed controls (11.2 ± 1.6 vs. 13.5 ± 1.7) N = 10 fat and 15 chow. G and H, Representative images of adherent splenic‐derived MACs. I, There was no difference in adhesion of splenic‐derived MACs to fibronectin from fat‐fed mice compared with chow‐fed controls (12.3 ± 1.7 vs. 11.1 ± 1.1) N = 11 fat and 8 chow. J, Enumeration of MACs derived from blood, bone marrow and spleen by cell culture after 7 d. Blood‐derived MACs from fat‐fed mice were more abundant than those from chow‐fed controls (8.75 ± 0.49 vs. 5.5 0.5) N = 8. There were fewer marrow‐derived MACs from fat‐fed mice compared with chow‐fed controls (10.25 ± 0.95 vs. 17.4 ± 0.99) N = 8. Spleen‐derived MACs from fat‐fed mice were also less abundant than those from chow‐fed controls (11.38 ± 1.01 vs. 26 ± 1.7) N = 8. K, There was no difference in systolic blood pressure in fat‐fed mice compared with chow‐fed controls (82 ± 4.7 mmHg vs. 86.2 ± 6.2 mmHg) N = 11 per group. Data are presented as ±SEM (*P ≤ 0.05, **P ≤ 0.01, ***P ≤ 0.001). HPF = high‐power field.
