Fig. 5.
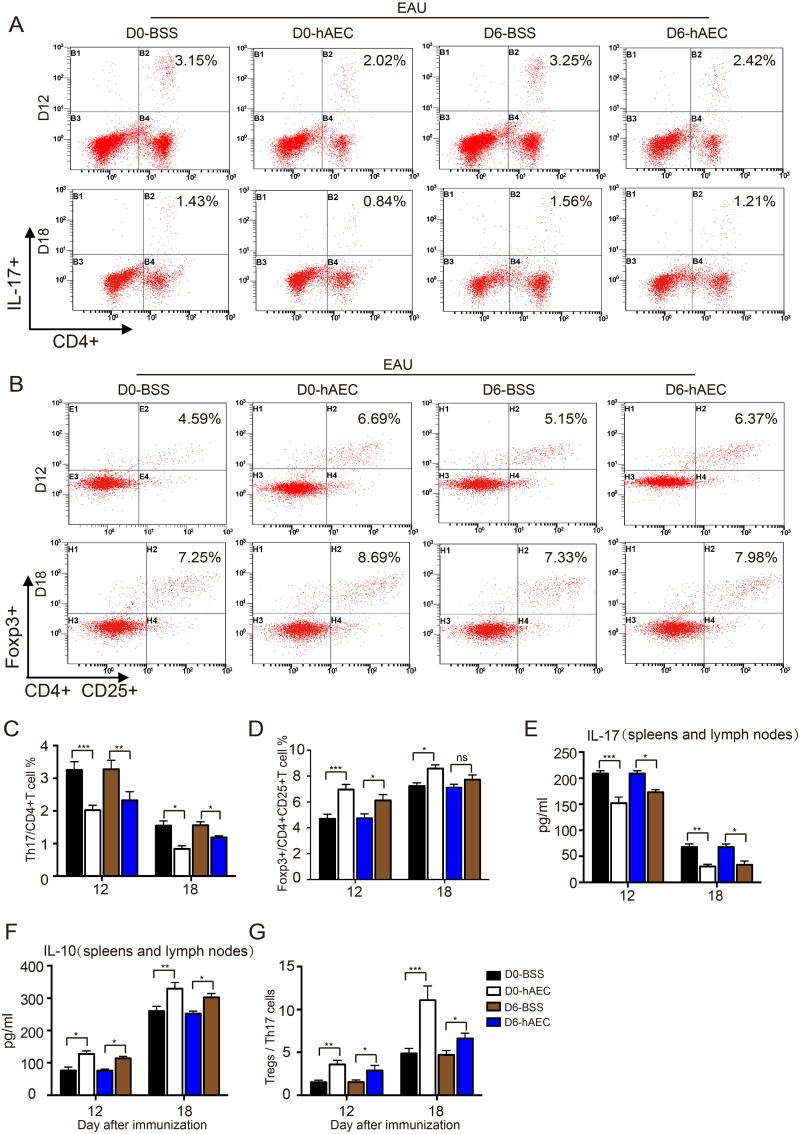
The effect of hAEC treatment on proportions of T-cells in EAU rats. EAU rats were treated with hAECs or vehicle solution (BSS) by subretinal injection on day 0 and day 6 after immunization, and spleens and lymph nodes were harvested on day 12 and day 18 after immunization (the peak and stable stage of the disease, respectively). Th17 and Treg cell proportions were determined by flow cytometry. Representative histograms are shown in (A, B) with quantification of mean intensity in (C, D). The T-cell subtype IL-17 (E) and IL-10 (F) cytokine levels in the spleens and lymph nodes were determined by ELISA. The ratios of Treg cells/ Th17 cells are shown in (G). Data are presented as the mean ± SEM. n = 6 in each group. *p < 0.05; **p < 0.01; ***p < 0.001. Statistical analysis was performed using a two-way ANOVA and Tukey’s multiple comparison test.
ANOVA: analysis of variance; BSS: balanced salt solution; EAU: experimental autoimmune uveitis; ELISA: enzyme-linked immunosorbent assay; hAEC: human amniotic epithelial cells; IL: interleukin; ns: no significance; SEM: standard error of the mean; Th: T helper; Treg: T regulatory.

