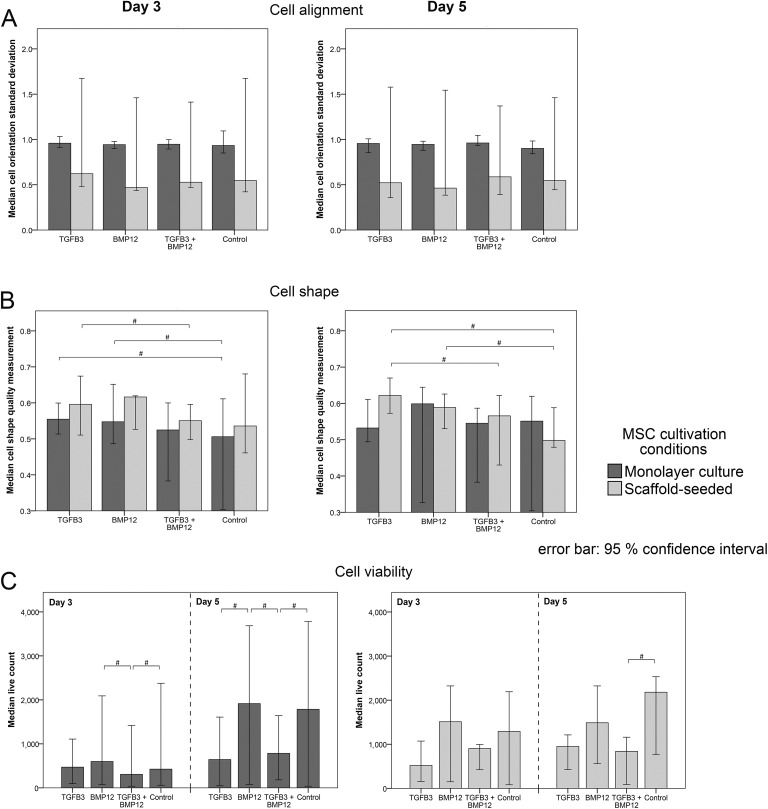
Fig 4.
Results of the quantitative analysis of images of LIVE/DEAD®-stained MSC-seeded tendon scaffolds and MSC monolayer cultures. Median values of the cell orientation standard deviation (A), the cell shape quality measurement (B) and of the counted live cells (C) assessed in monolayer-cultured and scaffold-seeded cells supplemented with TGFβ3, BMP12, TGFβ3, and BMP12 or without any growth factor at day 3 and day 5. High values of the cell orientation standard deviation mean that the majority of cells is not aligned parallel to a defined main direction and thereby indicating a less marked parallelism one to another. The scale for the cell shape quality measurement includes values between zero (round cell body shape) and one (elongated cell body shape). Bars represent median values and the error bars the 95% confidence interval; # illustrates significant differences between the marked sample groups (p < 0.05).

