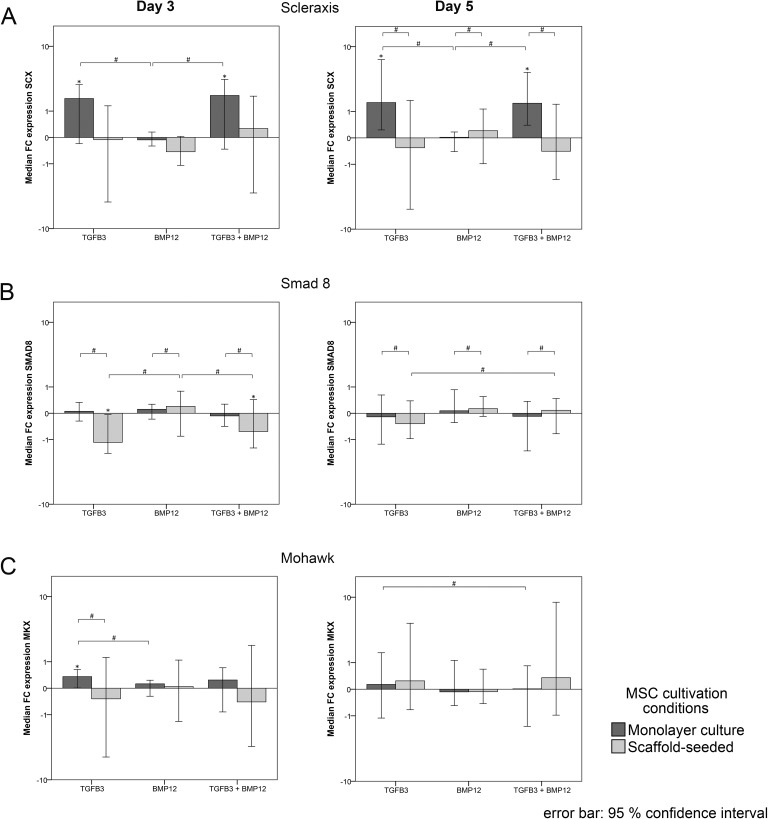
Fig 6.
Gene expression level of intracellular tendon markers. Gene expression in monolayer cultured and scaffold-seeded cells was assessed at day 3 (left) and at day 5 (right). Data are presented as median FC to the respective control of the monolayer and the scaffold culture, which received no growth factor supplementation and is displayed as horizontal line intersecting the x-axis at zero. Bars represent the median values and error bars the 95% confidence interval; * indicates significant differences compared with the respective control (p < 0.05); # illustrates significant differences between the marked sample groups (p < 0.05).

