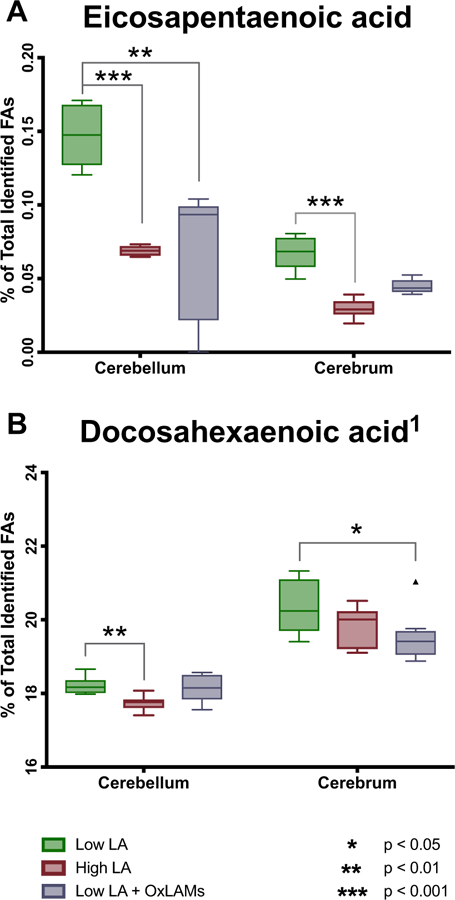
Fig. 2. Dietary LA and OXLAM-induced changes in n-3 fatty acid content of cerebellum and cerebrum.

N = 8 tissue samples per group. Y-axis ranges differ in each graph. Box plots are based on the Tukey method. P-values are derived from Dunn’s test of multiple comparisons using rank sums, reporting the Low LA reference group vs each of the other two groups. P-values are Sidak adjusted. LA, linoleic acid; OXLAM, Oxidized Linoleic Acid Metabolite.
