Figure 7.

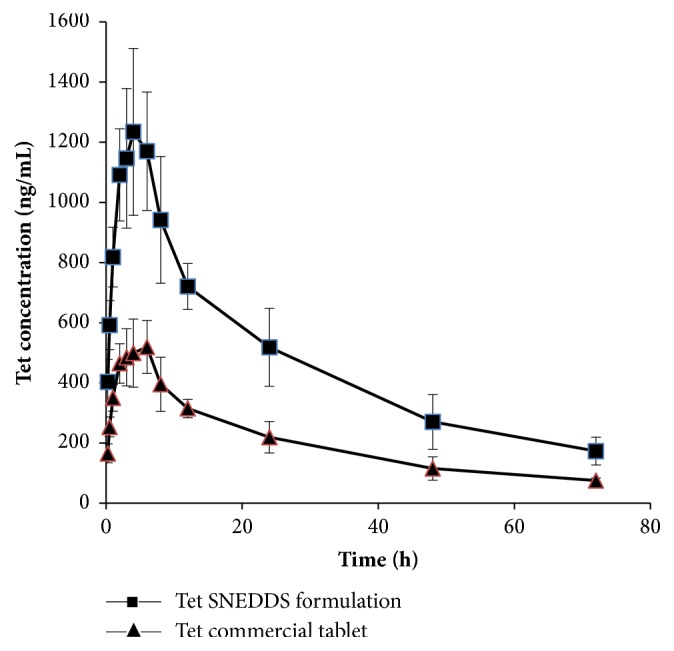
Plasma concentration profile of Tet after oral administration in male rats. Each value represents the mean ±S D (n=6 and 10 mg/kg).

Plasma concentration profile of Tet after oral administration in male rats. Each value represents the mean ±S D (n=6 and 10 mg/kg).