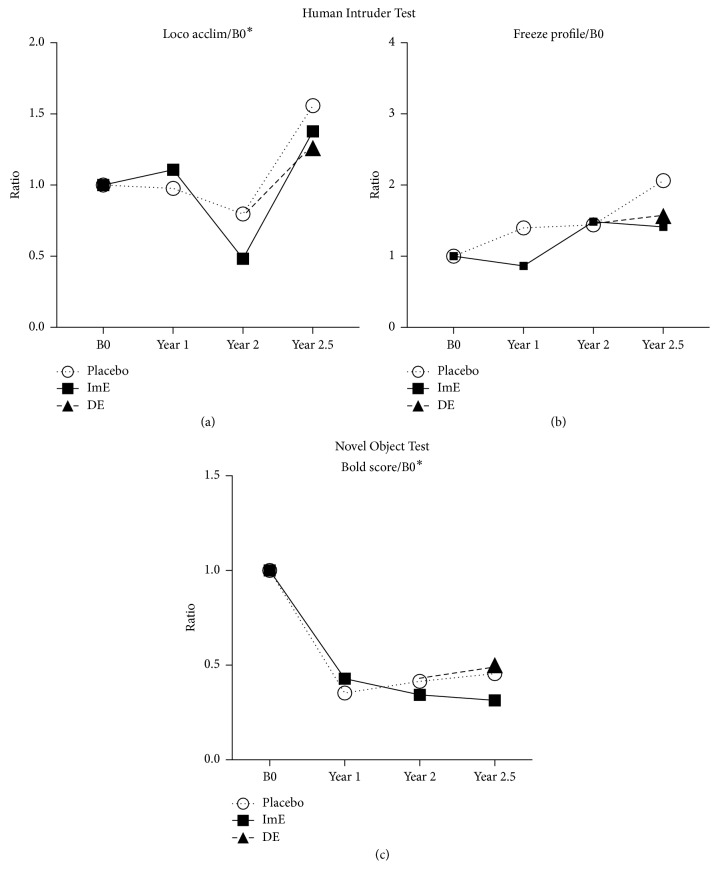
Figure 4.
(a) Locomotion (normalized to B0) during the acclimation period was different across time (p < 0.041) and between treatment groups (p < 0.030). There was a significant difference between year 2 and year 2.5 (Tukey post hoc p < 0.035). (b) There was no difference between treatments or across time in freezing after normalization to B0 due to a strange human profile presented. (c)The composite “Bold Score” normalized to B0 decreased significantly in all groups by the end of year 1 (time p < 0.0001) and remained lower than B0 for the entire protocol. (Title∗ different by 2-way ANOVA (p < 0.05); graph∗ different by post hoc test (p < 0.05)).

