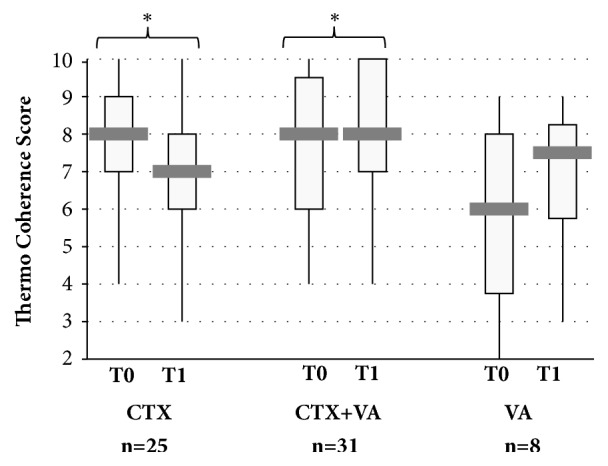
Figure 3.

Thermo coherence during therapy of breast cancer patients. Boxplots for the thermo coherence scores for the CTX-, CTX+VA, and VA-group at first diagnosis (T0) and 6 months later (T1). ∗Calculation of Cohen's d revealed for the CTX d[95% CI] = 0.70 [0.09, 1.31], p(d) = 0.02∗ and for the CTX+VA-group d [95% CI] = 0.96 [0.39, 1.53], p(d) < 0.01.
