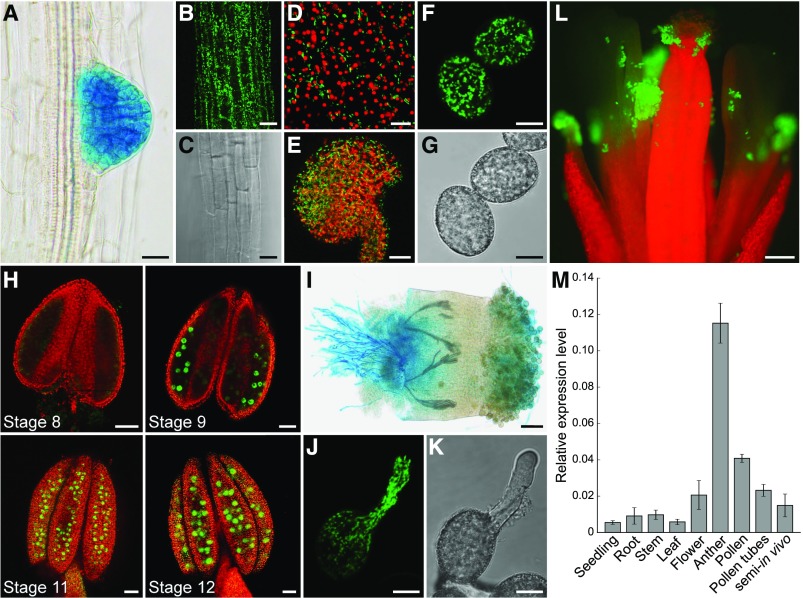
Figure 3.
Analyses of HXK1 Expression in Different Tissues by Reporter Plant Studies and RT-qPCR.
(A) and (I) Histochemical detection of GUS activity in Arabidopsis Col-0 expressing an HXK1pro:HXK1g-GUS construct.
(B) to (H) and (J) to (L) Detection of GFP fluorescence (green) by confocal microscopy in HXK1pro:HXK1g-GFP reporter plants. Chlorophyll autofluorescence is given in red.
(A) Root of an 8-d-old seedling with strong GUS staining in an emerging lateral root.
(B) Root epidermis cells with HXK1-GFP.
(C) Bright field of (B).
(D) Epidermal cells of a sepal.
(E) Maximum projection of an excised ovule.
(F) Mature pollen grains with HXK1-GFP at the mitochondria.
(G) Bright field of (F).
(H) Anthers of different floral stages with HXK1-GFP in developing pollen grains. All flower stages 1 to 20 were named according to Smyth et al. (1990).
(I) Pollen tubes grown semi-in vivo on a wild-type stigma.
(J) In vitro growing pollen tube.
(K) Bright field of (J).
(L) Open pollinated flower. Bars = 20 µm in (A) to (C) and (E), 10 µm in (D), (F), (G), (J), and (K), 50 µm in (H) and (I), and 200 µm in (L).
(M) Analysis of HXK1 transcript levels in different tissues. HXK1 transcripts were quantified by RT-qPCR using total RNA extracted from seedlings, roots, stems, leaves, pollinated flowers, young anthers, mature pollen, in vitro-germinated pollen tubes, and pollen tubes grown semi-in vivo through stigmata. The diagram depicts expression ratios relative to UBI10 expression in each tissue. Bars represent mean values ± se of three biological replicates with three technical replicates each. For each biological replicate, the tissue for RNA isolation was collected from a different Col-0 plant.

