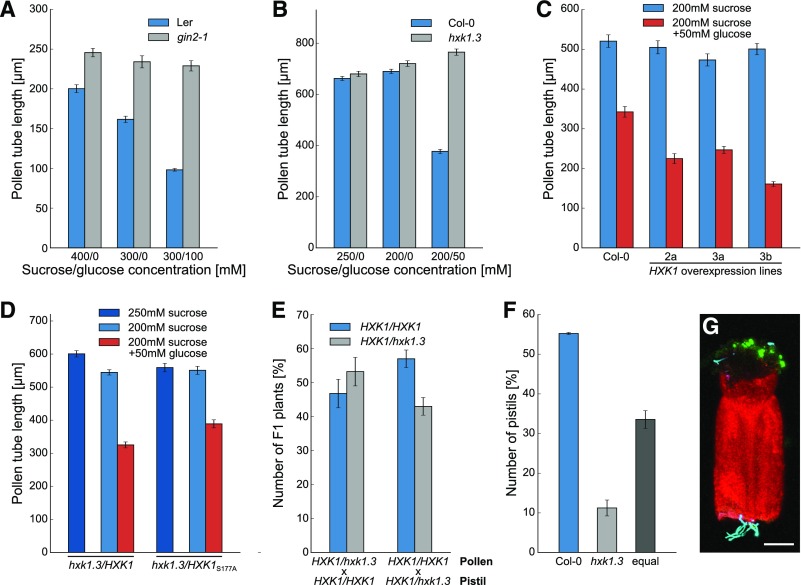
Figure 4.
Characterization of the Glucose-Insensitive Mutants gin2-1 and hxk1.3 Regarding Pollen Tube Growth.
(A) Mean lengths ± se of gin2-1 and wild-type (Ler) pollen tubes grown in vitro for 7 h on media with or without glucose (n ≥ 200 for every genotype on every sugar concentration).
(B) Lengths of hxk1.3 and wild-type (Col-0) pollen tubes grown in vitro for 7 h on media with or without glucose. Mean values of three independent experiments ± se are shown (n ≥ 600 in total for every mean value). Independent experiments were performed on different days with pollen from different plants.
(C) In vitro pollen tube lengths of three independent HXK1 overexpression lines in comparison to wild-type (Col-0) on media with or without glucose (n ≥ 200 pollen tubes for each line).
(D) Pollen tube lengths of hxk1.3 complementation lines on medium with or without glucose. Complementation lines were generated by transformation of homozygous hxk1.3 plants with LAT52pro:HXK1c or with LAT52pro:HXK1cS177A encoding a catalytically inactive form of HXK1. Bars represent means of three biological replicates ± se (n ≥ 370 for every mean value).
(E) Genotypes regarding HXK1 in the F1 descendants of cross-pollination experiments with heterozygous hxk1.3/HXK1 pollen and pistils from Col-0 plants. Reciprocal crosses were performed with Col-0 pollen and heterozygous hxk1.3/HXK1 pistils. Bars represent mean values of the percentage of each genotype in the F1 generation of four independent crossings (four different plants were used for crossing; n ≥ 98 F1 seedlings in total).
(F) Results of the “pollen-tube race” experiment. Col-0 pistils were pollinated with GFP-labeled hxk1.3 pollen and Col-0 pollen expressing TagRFP-T, cut in the middle, and placed horizontally on germination medium. The graph depicts which pollen tubes emerged first form the cut-surface. Mean values ± se of three independent replicates (pollen and pistils of different plants were used on three different days) with 70 stigmata in total.
(G) Representative confocal image of a “pollen-tube race” experiment. GFP is given in green, TagRFP-T in cyan, and chlorophyll autofluorescence in red. Bar = 150 µm.

