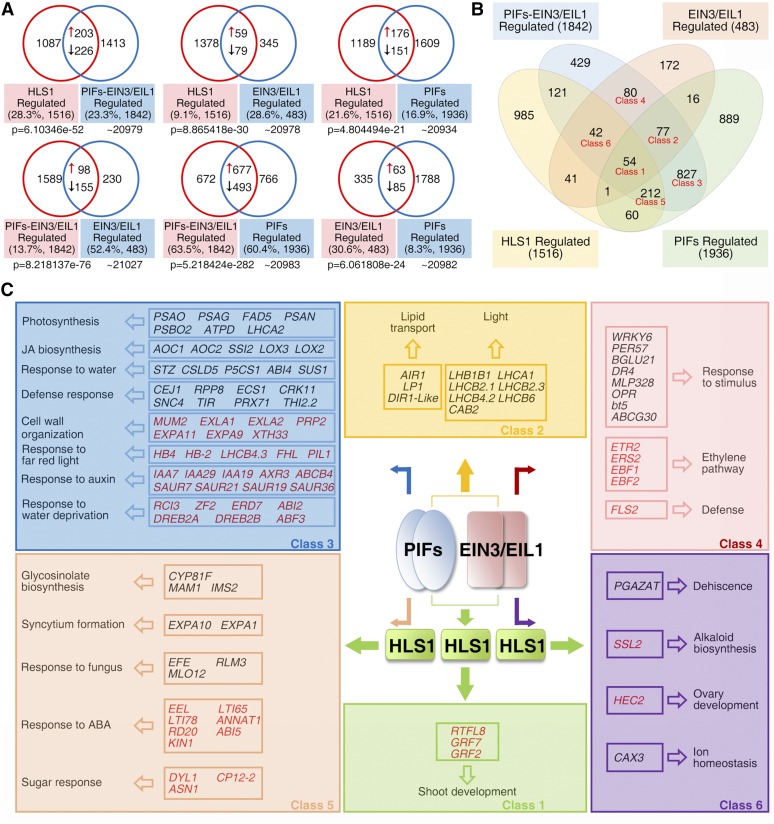
Figure 9.
PIFs and EIN3/EIL1 Additively and Distinctly Regulate Myriad Biological Processes.
(A) Venn diagrams showing the pairwise overlap between the HLS1-, PIF-EIN3/EIL1-, EIN3/EIL1-, and PIF-regulated gene sets. “↑” represents activated genes that show decreased transcript levels in both mutants (compared with Col-0); “↓” represents repressed genes that show elevated transcript levels in both mutants (compared with Col-0). Genes showing opposite changes of expression in two compared mutants were excluded from the overlap. Percentage values indicate the percentage of overlapping genes among total regulated genes. P values were calculated using the hypergeometric distribution.
(B) Venn diagram showing the overlaps among the HLS1-, PIF-EIN3/EIL1-, EIN3/EIL1-, and PIF-regulated gene sets. Genes sharing accordant transcriptional pattern among mutants were counted as overlaps. Classes 1 to 6 were selected for the GO enrichment analysis in (C).
(C) Summary of action for EIN3/EIL1 and PIFs, which function as a transcriptional couple in the regulation of HLS1 and other downstream genes in diverse processes. Representative genes with known functions in various biological processes are listed. Repressed and activated genes (thus, up- and downregulated in corresponding mutants) are shown in black and red, respectively.

