Figure 3.
ERD2-Mediated ER Retention in Situ.
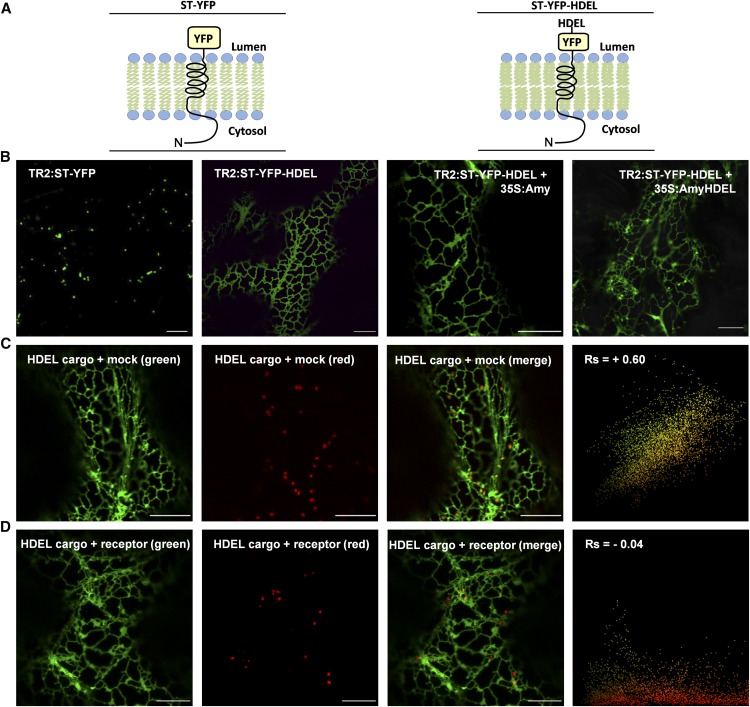
(A) Illustration of the membrane topology of the Golgi-marker ST-YFP and ST-YFP-HDEL with the N terminus (N) in the cytosol and the YFP exposed in the lumen.
(B) CLSM images from infiltrated tobacco leaves showing the subcellular localization of ST-YFP and its variant ST-YFP-HDEL under control of the weak TR2 promoter alone (left two panels). The two panels to the right show ST-YFP-HDEL expression in the presence of the strong CaMV35S promoter-mediated overexpression of either Amy or Amy-HDEL from the same T-DNA.
(C) The dual HDEL cargo expression vector (TR2:ST-YFP-HDEL + 35S:Amy-HDEL) was coinfiltrated with a second dual expression vector encoding the Golgi marker TR2:ST-RFP together with a neutral effector 35S:PAT for control purposes (mock). Notice that punctate ST-YFP-HDEL structures colocalize with the Golgi signals confirming their identity (white arrowheads). The scatterplot from multiple images analyzed for punctate structures only shows a single yellow population and a positive Spearman correlation coefficient (Rs).
(D) Suppression of saturation: The same experiment as in (C), but the neutral effector 35S:PAT was replaced by 35S:ERD2 (receptor). Notice the lack of ST-YFP-HDEL signals in the red Golgi bodies. White arrowheads show red fluorescence in red and merged channels, but no fluorescence in the green channel. The scatterplot from multiple images analyzed for punctate structures only shows a predominantly red pixel population. Occasional overlap with green fluorescence is due to vicinity to the ER but does not correlate, as indicated by a negative Rs value. Bars in all panels = 10 µm. See Supplemental Figures 1A and 1B for alternative color combinations.

