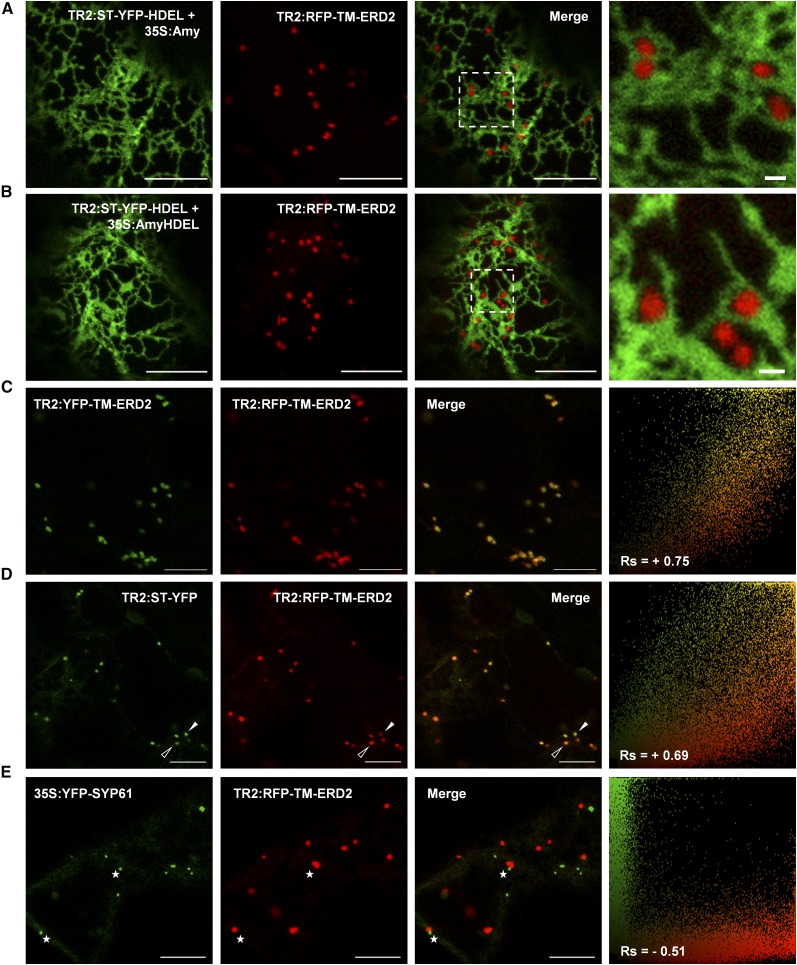
Figure 7.
Testing the Colocalization of Biologically Active ERD2 Fusions.
(A) CLSM showing the distribution of RFP-TM-ERD2 in the absence of ligand overexpression by coexpression with the control construct (TR2:ST-YFP-HDEL + 35S:Amy).
(B) CLSM demonstrating in situ biological function of RFP-TM-EDR2 coexpressed with the HDEL overdose test construct (TR2:ST-YFP-HDEL + 35S:AmyHDEL). Bars = 10 µm.
(C) and (D) Close-ups of the enlarged dashed rectangle show that RFP-TM-ERD2 punctae are well separated from the ER. Bars in the close-ups = 1 µm. See Supplemental Figure 4A for alternative color combinations and Figure 4B for correlation analysis.
(C) CLSM image showing YFP-TM-ERD2 coexpressed with RFP-TM-ERD2 showing high level of colocalization, illustrated by a single yellow pixel population in the scatterplot and a high positive Rs.
(D) CLSM image of RFP-TM-ERD2 coexpressed with the Golgi-marker ST-YFP showing consistent colabeling of the same Golgi bodies, but with less correlation between green and red signals, showing a range between mostly red (open arrowheads) or mostly green (white arrowheads) structures, reflected by a broader scatterplot and a lower Rs.
(E) CLSM image of RFP-TM-ERD2 coexpressed with the TGN marker YFP-SYP61, showing totally separate structures that are either green or red. A strong negative Rs and two completely separate pixel populations demonstrate a complete lack of colocalization even when found adjacent to each other (white stars). Bars = 10 µm.

