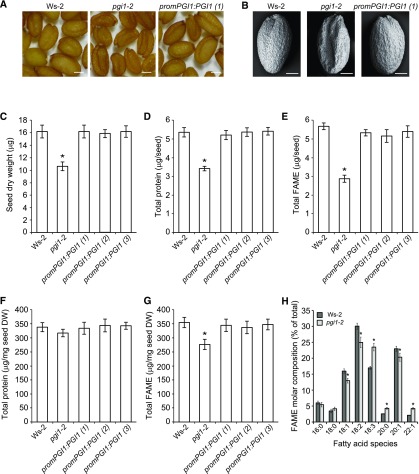
Figure 4.
Protein and FA Contents Are Diminished in pgi1-2 Seeds.
(A) and (B) External phenotype (A) and scanning electron micrographs (B) of seeds from wild-type (Ws-2) and pgi1-2 plants, and one line of pgi1-2 plants ectopically expressing PGI1 under the control of the PGI1 promoter [promPGI1:PGI1(1)].
(C) to (G) Seed dry weight (C), total protein content per seed (D), total FAME contents per seed (E), total protein content on DW basis (F), and total FAME content (G) on DW basis of dry seeds of the wild type, pgi1-2, and three independent lines of pgi1-2 plants ectopically expressing PGI1 under the control of the PGI1 promoter [promPGI1:PGI1(1-3)].
(H) FA profile of dry mature wild-type and pgi1-2 seeds.
Values in (C) to (H) represent the means ± se of four biological replicates obtained from four independent experiments, each biological replicate being a pool of 300 seeds (C), 200 seeds ([D] and [F]), or 20 seeds ([E], [G], and [H]). Asterisks indicate significant differences from wild-type seeds according to Student’s t tests (P < 0.05). Bars in (A) and (B) = 200 and 100 μm, respectively.

