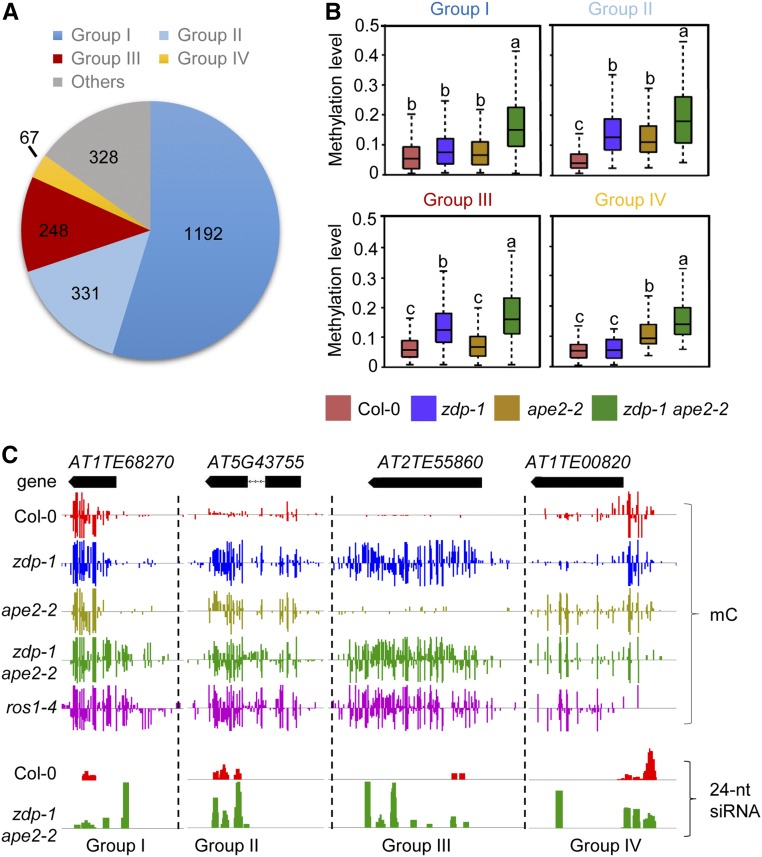
Figure 2.
APE2 and ZDP Play Overlapping Roles in Active DNA Demethylation.
(A) Pie chart showing proportions of different groups of hyper-DMRs in zdp-1 ape2-2. Group I: Loci not affected by the single APE2 or ZDP mutation, but hypermethylated upon double mutations of APE2 and ZDP. Group II: Loci hypermethylated in both of the two single mutants. DNA methylation levels further increase in the double mutant. Groups III and IV: Loci hypermethylated in one single mutant, but not in the other.
(B) Box plots showing the DNA methylation levels of the four groups of loci as categorized in (A). Dark horizontal line, median; edges of boxes, 25th (bottom) and 75th (top) percentiles; whiskers, minimum and maximum percentage of DNA methylation. Significant differences between two groups are marked with different letters (P < 10−15, Mann-Whitney U test).
(C) Snapshots in the Integrated Genome Browser showing the levels of DNA methylation and 24-nucleotide siRNAs at the indicated representative loci.

