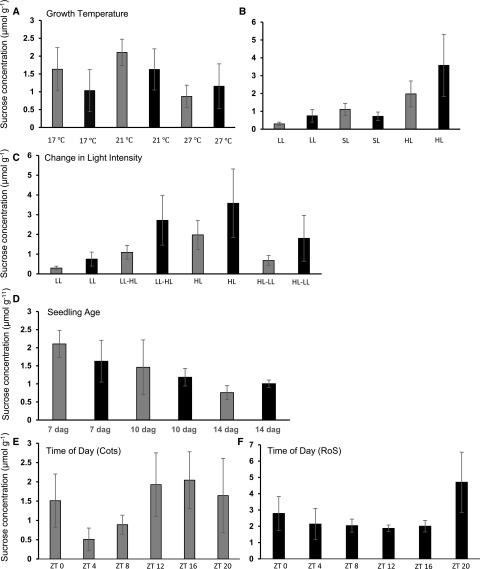
Figure 4.
Suc concentration in both the source and sink tissues varies under different environmental conditions. Suc concentration was measured in an enzymatic assay from the cotyledons (Cots, gray bars) and the rest of the seedling (RoS, black bars) grown under a range of environmental conditions. A, Growth temperature. B, Light intensity. LL, Low light; SL, standard light; HL, high light. C, Dynamic changes in light intensity; seedlings grown under one light intensity were switched to the opposite at dawn and harvested after 2 h. D, Seedling age. E, Time of day, cotyledons only. ZT, Zeitgeber time; ZT0 is defined as time of lights on. F, Time of day, RoS only. Error bars represent se, n = 4 across three independent replicates. *P ≤ 0.05 for Suc concentration compared with the relevant control calculated by t test on log-transformed data.

