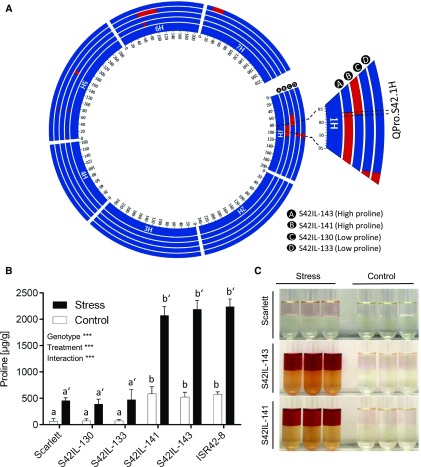
Figure 1.
Genetic mapping and validation of major QTLs for Pro accumulation. A, Circos plot showing the genetic map of four selected wild barley introgression lines carrying ISR42-8 and Scarlett alleles at the QTL region on chromosome1H. B, Quantification of Pro QTL QPro.S42-1H in four introgression lines. Bars represent the mean ± se (n = 5). Different letters indicate significant difference of genotypes and primes show differences between control and drought stress (P < 0.05) using Tukey’s HSD test. Pr (C) Free Pro reaction with ninhydrin. A darker color indicates more Pro accumulation in the samples.

