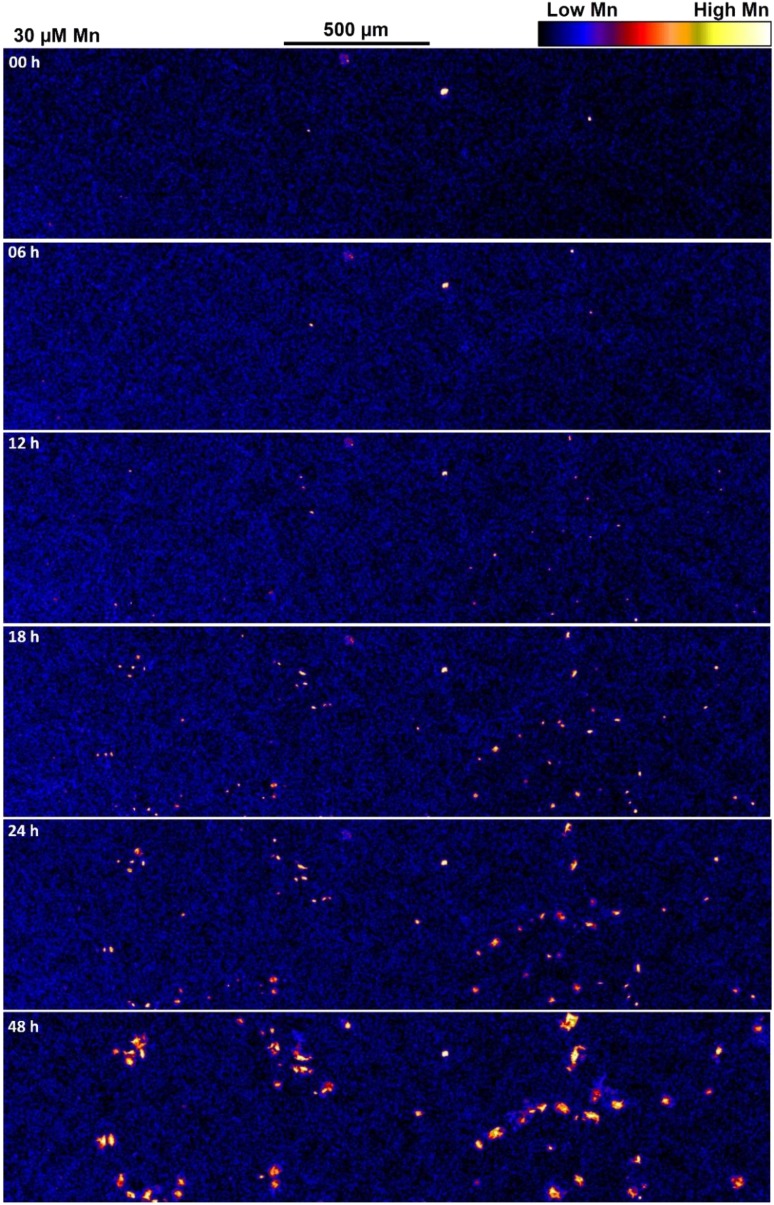
Figure 4.
XFM images showing the distribution of Mn in a portion of a cowpea leaf exposed to 30 μm Mn. The area shown here represents only approximately 1.5% of the 8.5-megapixel image obtained for each time interval, which included portions of leaves exposed to both 0.2 and 30 μm Mn. The total area analyzed (i.e. 8.5 megapixels) at each time interval was 120 mm2, as indicated by the white rectangle in Supplemental Figure S2B. See Blamey et al. (2018b).

