Figure 8.
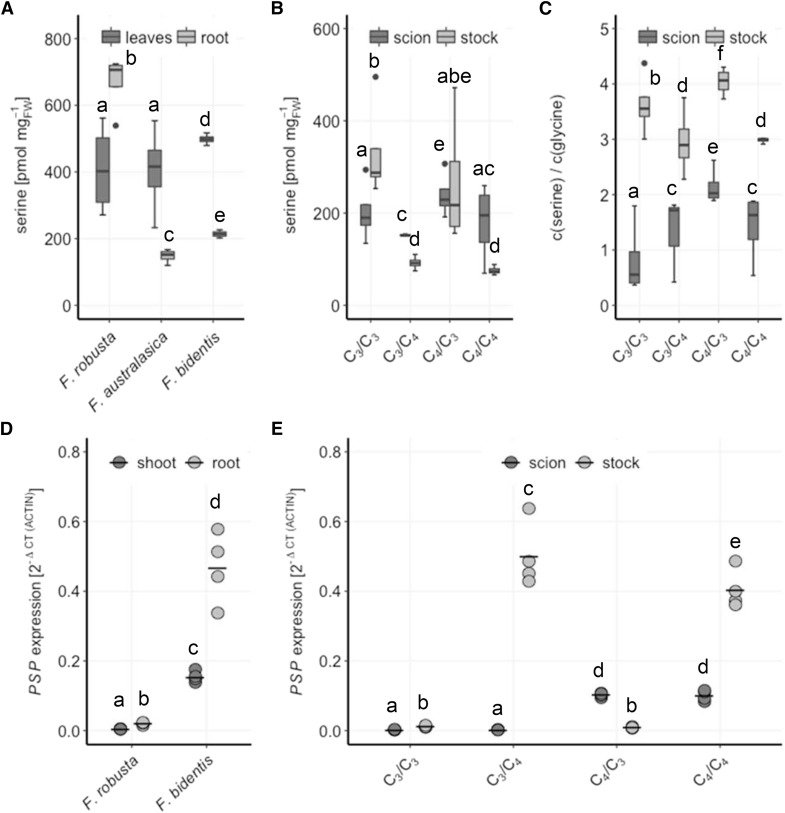
Ser biosynthesis in Flaveria species and interspecies grafts of F. robusta and F. bidentis. A, Leaf and root Ser concentrations were analyzed in 23-d-old seedlings of F. robusta (C3), F. australasica (C4), and F. bidentis (C4). B, Seedlings of F. robusta and F. bidentis were grafted 5 d after germination and analyzed 35 d after grafting for steady-state Ser concentrations. C, Ser-Gly ratio in scions and stocks of the grafted plants in 7B and 8B were calculated. Data are shown as box plot (25–75%), the line represents median, the whiskers represent 1.5 IQR, n = 4. D PSP transcript levels relative to ACTIN in shoots and roots in 20-d-old seedlings of F. robusta (C3) and F. bidentis (C4). E, Seedlings of F. robusta and F. bidentis were grafted 5 d after germination and analyzed 35 d after grafting. Transcript levels of PSP relative to ACTIN are shown. Crossbar, mean; n = 4. Different letters represent values significantly different at P < 0.05 (Student’s t test).

