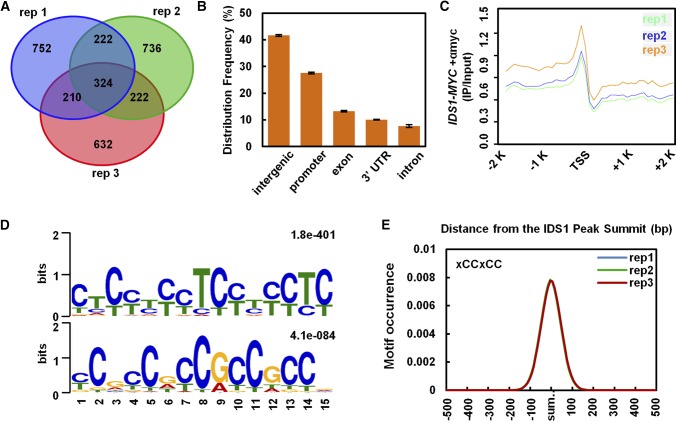
Figure 3.
IDS1 binding site analysis in the rice genome. A, Venn diagram depicting genes reproducibly associated with IDS1 binding peaks in the ChIP-seq analysis of three replicates. B, Relative distribution of IDS1 binding peaks in the rice genome. Error bars represent sds among three independent replicates. C, IDS1 binding peaks highly enriched in −2,000 to 0 bp of promoter regions in seedlings. D, MEME motif search identifying two dominant IDS1-binding motifs, defined as GCC-box or GCC-box-like (xCCxCC) motifs. E, Distribution of IDS1 binding motifs in the 200-bp regions surrounding the IDS1 binding peak summits.

