
Figure 6.
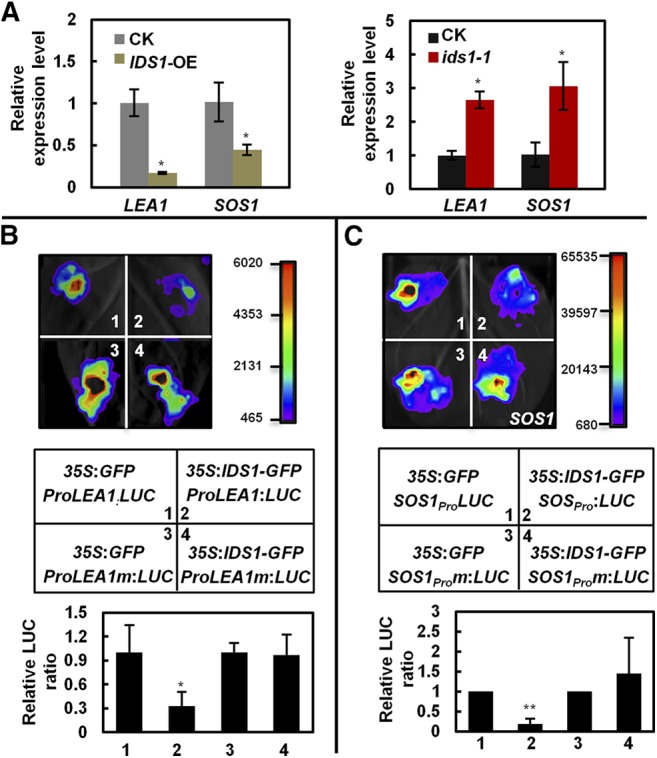
IDS1 negatively regulates the expression of LEA1 and SOS1 in rice. A, Transcription levels of LEA1 and SOS1 in IDS1-OE (left) and ids1-1 (right) rice materials. ACTIN was the internal control. Error bars represent sds among three independent replicates. B and C, Transient expression assays illustrating the transcriptional repression of LEA1 (B) and SOS1 (C) by IDS1. The 2-kb promoters of LEA1 and SOS1 containing the wild-type or mutated GCC-box motifs were separately used to drive the LUC gene expression and were coexpressed with 35S:GFP or 35S:IDS1-GFP in N. benthamiana leaves. LUC activities were determined 48 h postinfiltration. Quantification of the relative luminescence intensities (n = 4) is shown in the bottom of B and C. The mean values of each combination were normalized against controls. Error bars represent sds among three independent replicates. *P < 0.05 and **P < 0.01 (Student’s t test).