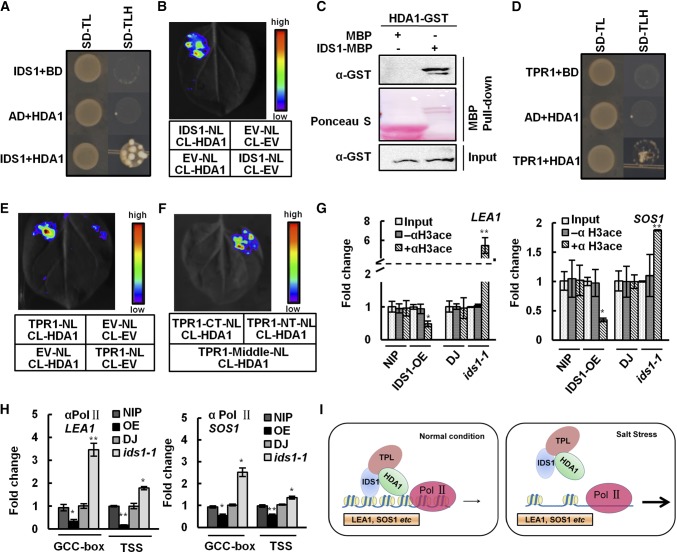
Figure 8.
IDS1, TPR1, and histone deacetylase HDA1 physically interact with each other and lead chromatin remodeling in LEA1 and SOS1 promoter regions. A, Y2H assay showing the interaction of IDS1 and HDA1. B, LCI showing the interaction of IDS1 and HDA1. C, Pull-down assay confirming the interaction between IDS1 and HDA1. D, Y2H assay revealing the interaction between TPR1 and HDA1. E, LCI showing the interaction of TPR1 and HDA1. F, LCI showing that the N-terminal domain of TPR1 mediates its interaction with HDA1. TPR1-NT, TPR1-MD, and TPR1-CT represent truncated versions of TPR1 as shown above. ChIP assays by using the anti-acetyl-histone H3 (G) or Pol II antibodies (H) were performed to measure the histone acetylation levels (G) and Pol II assembling (H) at the promoter regions of LEA1 and SOS1 in the IDS1-OE, ids1-1 mutant, and wild-type (NIP and DJ) seedlings. The specific amplicons were described as above. I, A model for the IDS1 function in rice salt tolerance. Error bars (in G and H) represent sds among three independent replicates. *P < 0.05 and **P < 0.01 (Student’s t test).

