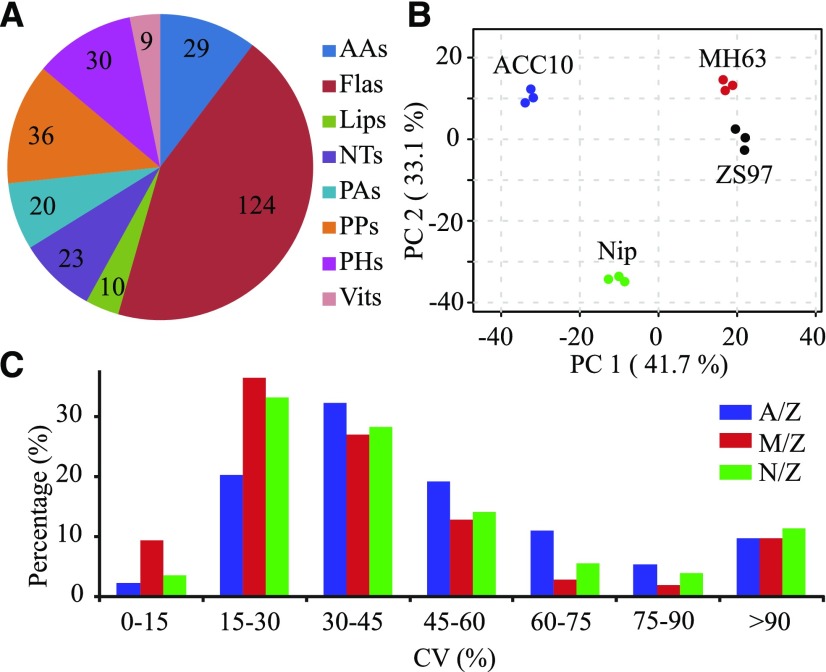
Figure 1.
Schematic representation of metabolic profiles of different lines. A, A total of 281 metabolites, comprising AAs (29), Flas (124), Lips (10), nucleotides (NTs; 23), PAs (20), PPs (36), PHs (30), and Vits (nine), were detected in this study. B, Principal component analysis of the 281 metabolites in the four parental lines ACC10, MH63, Nip, and ZS97. PC1 and PC2 refer to the first and second principal components, respectively. C, Distribution of CV among the three independent CSSL populations. A/Z, M/Z, and N/Z represent the ACC10/ZS97, MH63/ZS97, and Nip/ZS97 CSSL populations, respectively.

