Figure 4.
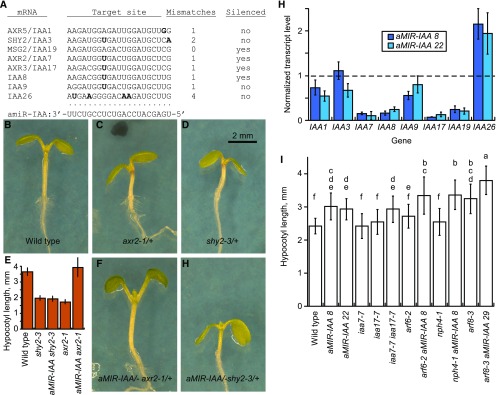
aMIR-IAA plants. A, Predicted amiR-IAA sequence base pairing to selected IAA genes. G:U base pairs are allowed. IAA gene mRNA sequences are shown 5′ to 3′. Bases not expected to pair with aMIR-IAA are indicated in boldface. B to D, F, and G Photographs of 7-d-old seedlings of the indicated genotypes. E, Mean hypocotyl lengths of the seedlings shown in B to D, F, and G, showing suppression of axr2-1 but not shy2-3. n = 9 to 13. Error bars indicate sd. H, RT-qPCR of IAA genes in two different P35S:aMIR-IAA lines. n = 3. Error bars indicate sd. The horizontal dashed line indicates a normalized wild-type expression level of 1 for each gene. I, Hypocotyl lengths in short days. Error bars indicate sd. n = 13 to 46.

