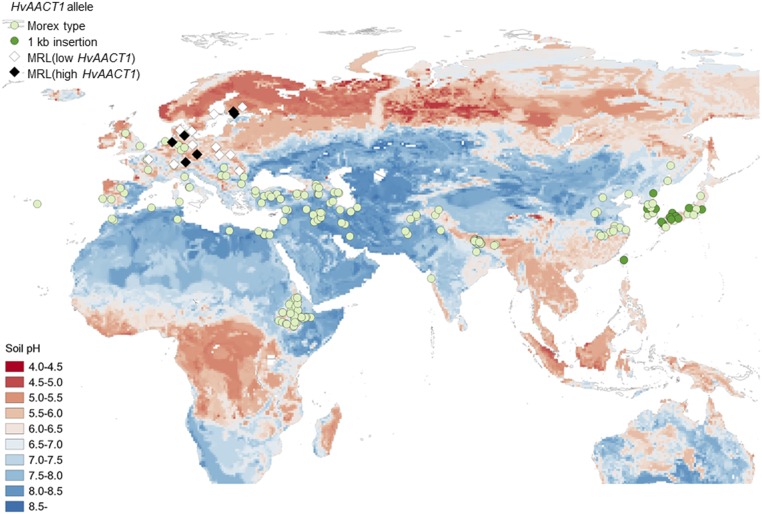
Figure 7.
Geographic distribution of barley accessions with novel MRL insertions. Genotyping of the MRL insertion was performed by PCR using primer pair 3 (Supplemental Table S3) in 274 cultivated barley accessions. Accessions with the MRL insertion and either high or low HvAACT1 expression are indicated with black and white diamonds, respectively. Accessions with or without the 1-kb insertion, the latter being Morex type, are indicated with dark-green and light-green circles, respectively.

