Figure 1.
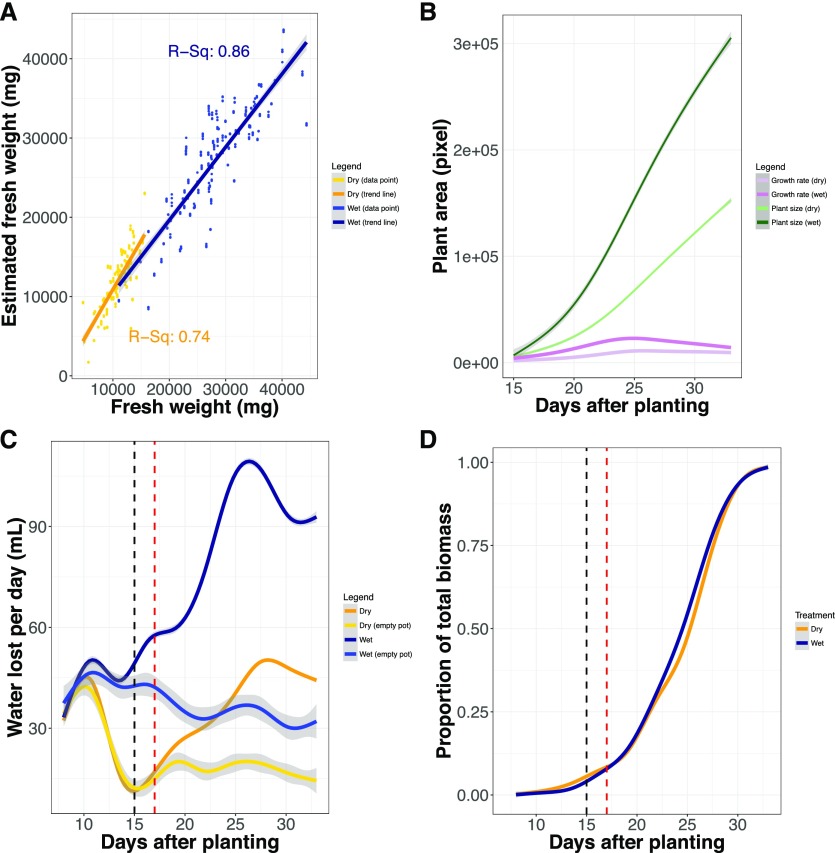
Plant size and water use can be inferred accurately throughout a majority of the plant life cycle. A, Correlation between plant fresh weight biomass estimated from side-view pixel area and actual plant fresh weight biomass measured gravimetrically. B, Estimates of plant size and growth rate based on pixel area are plotted across the duration of the experiment. Green lines reflect absolute average size, whereas purple lines report on growth rate. Dark and lighter shaded lines report the well-watered and water-limited treatment blocks, respectively. C, Daily water loss is plotted throughout the duration of the experiment. Dark blue and orange lines correspond to average daily water lost from pots, whereas the lines with lighter shades of similar colors report the average water loss of empty pots. The dashed black line denotes the day at which dry down within the water-limited treatment block is complete, whereas the dashed red line demarks when water use can be measured accurately. D, Proportion of total biomass accumulated throughout the duration of the experiment. The dashed black line denotes the day at which dry down within the water-limited treatment block is complete, whereas the dashed red line demarks when water use can be measured accurately.

