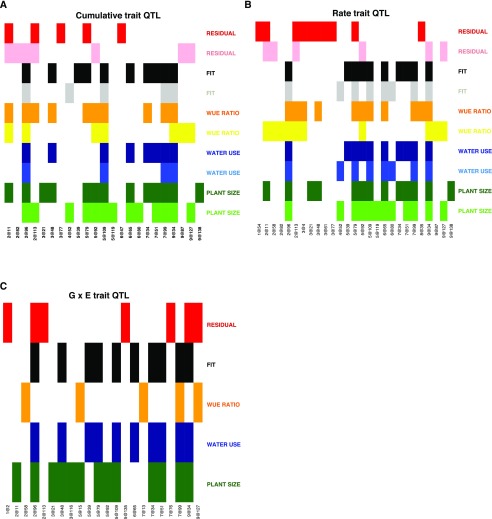
Figure 5.
The genetic components that contribute to subsets of traits largely overlap. The QTL locations identified are plotted on the x axis, and the traits are plotted on the y axis. Colored matrix entries denote at least one significant association within this experiment. A, Genetic architecture of cumulative traits. B, Genetic loci associated with trait rate of change. C, Genetic components associated with genotype × environment traits.

