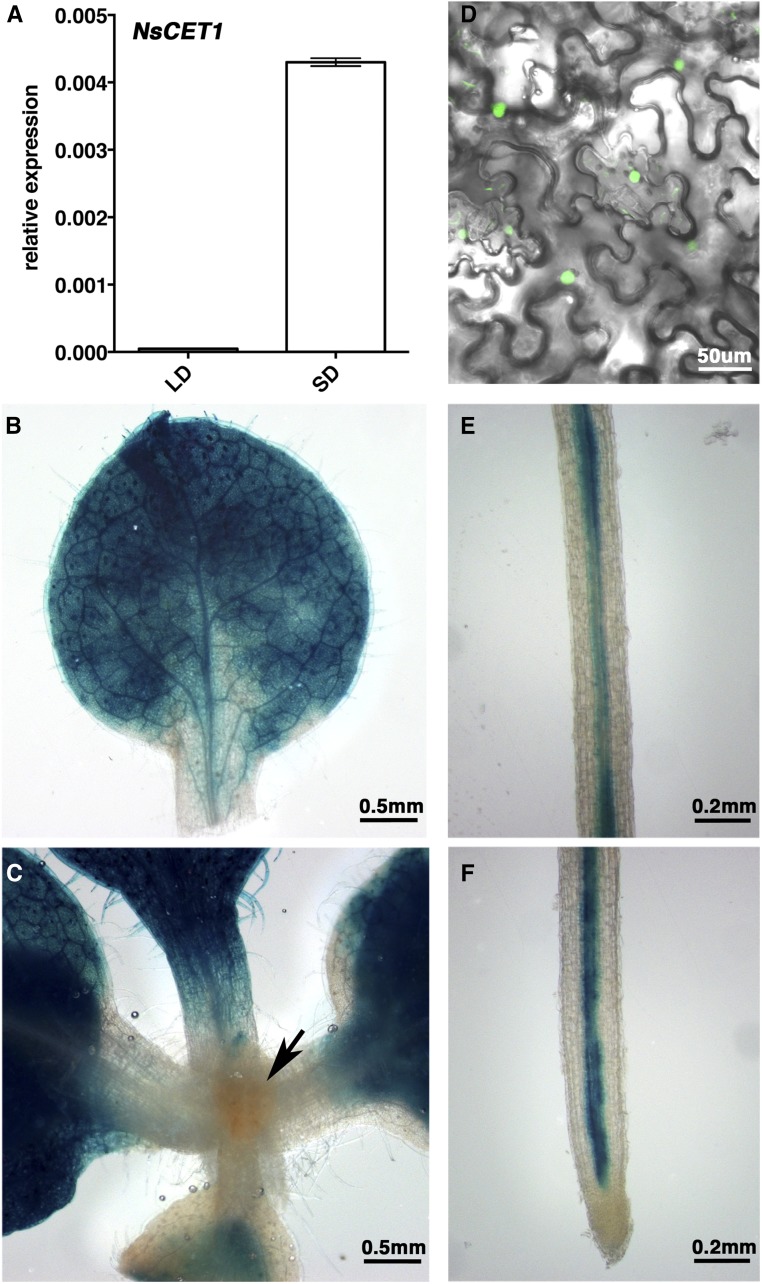
Figure 2.
Expression pattern of NsCET1 in N. sylvestris. A, Reverse transcription-quantitative PCR (RT-qPCR) analysis of NsCET1 mRNA levels in N. sylvestris under LD or SD conditions. The relative expression of NsCET1 was normalized to β-tubulin expression. B and C, Histochemical staining of leaf (B) and apex (C; indicated by the arrow) tissue of N. sylvestris transformants carrying a 5.5-kb fragment of NsCET1 promoter fused with a GUS reporter gene. Bars = 0.5 mm. D, BiFC assay of the interaction between NsCET1 and FD. VYNE(R)-CET1 and SCYCE(R)-FD were coinfiltrated in leaves of Nicotiana benthamiana by agroinfiltration. Bar = 50 μm. E and F, Histochemical staining of root (E) and root tip (F) tissue of N. sylvestris CET1pro-GUS transformants. Bars = 0.2 mm.

