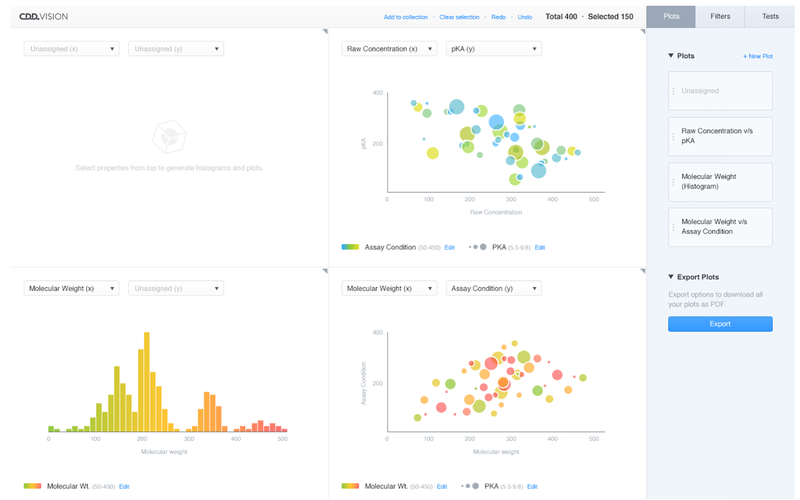
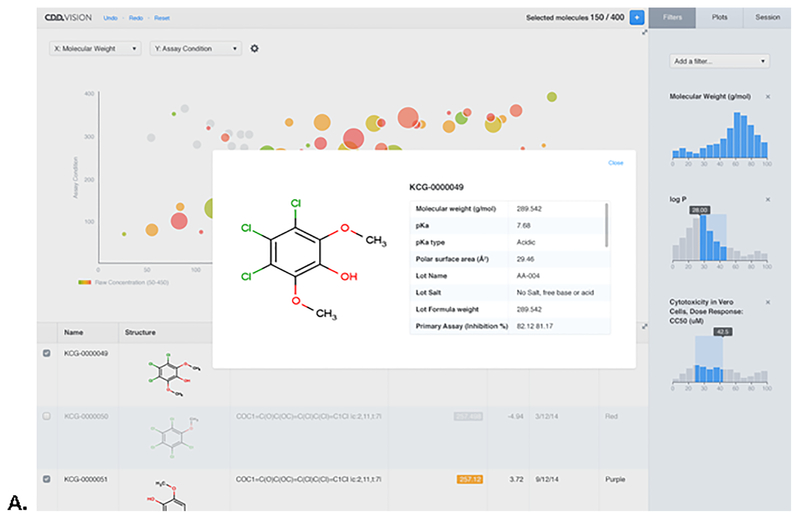
Figure 3.
A. Screenshot of the new Visualization capabilities in CDD Vault, showing The Broad Chagas disease dose response dataset that was used in a recent study by us to build a Bayesian machine learning model [2]. B. A screenshot showing highlighting of structures and filtering of data (right of screen). DOI: 10.6084/m9.figshare.3206266


