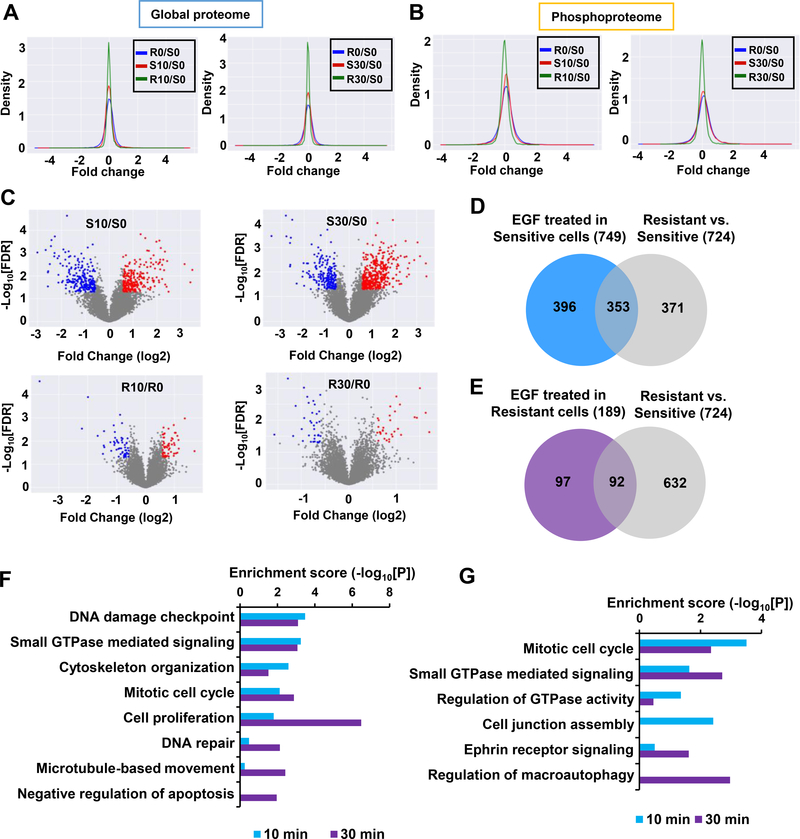
Figure 3. Distinct protein alteration patterns in T24R and T24S cells after EGF stimulation.
A and B. Density plots are shown for the log2 fold changes of the (A) global proteome and (B) phosphoproteome for T24R and T24S cells after 10 mins and 30 mins of EGF treatment. Only phosphopeptides or proteins quantified in at least two samples were plotted. Log2 fold changes in T24S cells at 10 mins (S10) vs. 0 min (S0) of EGF treatment, T24S cells at 30 mins (S30) vs. 0 min (S0) of EGF treatment, T24R cells at 10 mins (R10) vs. 0 min (R0) of EGF treatment, T24R cells at 30 mins (R30) vs. 0 min (R0) of EGF treatment, and R0 vs. S0 are displayed. C. Volcano plots display differentially expressed phosphopeptides in T24R and T24S cells after 10 mins and 30 mins of EGF treatment. Red and blue dots indicate up- and downregulated phosphopeptides, respectively. Only those quantified in at least two samples were plotted. D and E. Number of phosphoproteins associated with cisplatin resistance mechanisms that are involved in EGFR signaling in (D) T24S and (E) T24R cells. Venn diagram depicts the overlapping altered phosphoproteins in (D) T24S or (E) T24R cells with or without EGF treatment. F and G. Enriched cellular functions of the overlapping proteins after 10 mins and 30 mins of EGF treatment in (F) T24S and (G) T24R cells.

