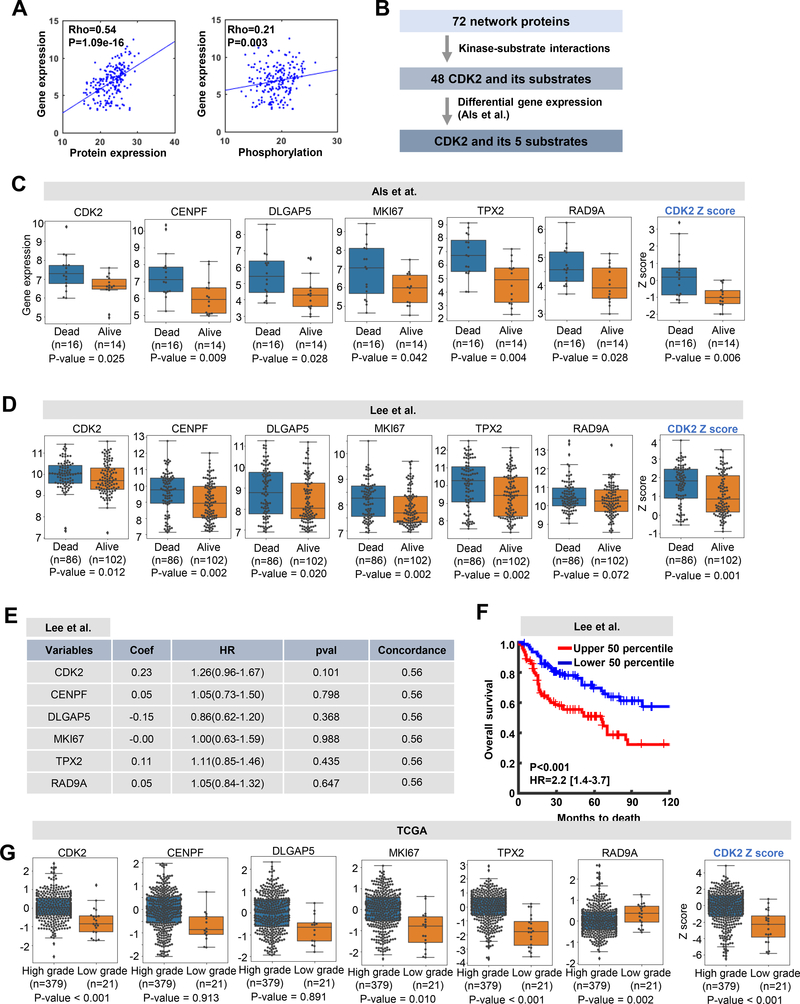
Figure 6. CDK2 network may have clinical implications in BC.
A. Correlation of 72 network proteins in levels of gene expression vs. protein expression (left) or phosphorylation (right). Dots on the scatter plot represent proteins and lines represent regression lines. Correlation was measured using the Spearman’s rank correlation method. B. Selection criteria used to identify the 6 proteins from the 72 network proteins. C and D. Box plots display differential gene expression of the selected 6 proteins from the network model using the gene expression datasets from (C) Als et al. and (D)Lee et al. Box plots at the far right display differential representation of CDK2 network scores computed by the Z-score method. Significance levels of differential gene expression between BC patients who were alive and deceased after cisplatin treatment were computed via the Wilcoxon rank-sum test. E. Regression coefficient and significance of the 6 genes based on multivariate Cox regression analysis using Lee at al. dataset. F. Kaplan-Meier curves for overall survival based on the expression of the CDK2 network genes are shown for the high (upper 50th percentile; n=97) and low (lower 50th percentile; n=91) z-score groups from the Lee et al. patient dataset. P-values and hazard ratios (HRs) were taken from a Cox regression analysis. G. Box plots display differential expression of the 6 genes in the TCGA BC cohort. Wilcoxon rank-sum test was performed to compute significance of differential expression between high and low grade samples.

