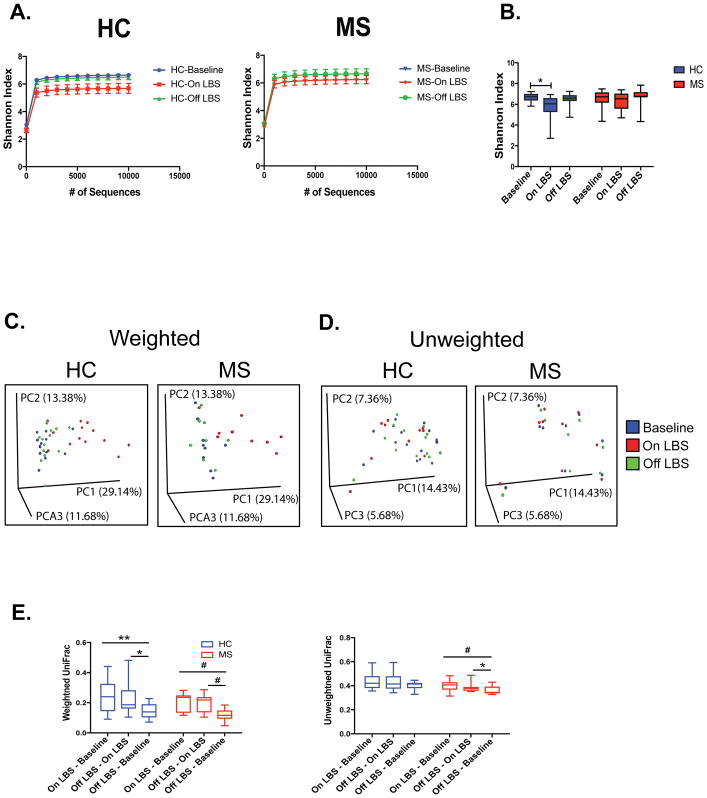
Figure 2. LBS effect on alpha and beta diversity of the gut microbiome.
Rarefaction curves were calculated at multiple sequence depths on MiSeq platform for Shannon entropy to compare differences in alpha-diversity at the indicated time points in A) healthy controls (n=13) and multiple sclerosis (MS) patients (n=9). Shannon index was also measured at a depth of 10000 reads in B) healthy controls (HC) and MS patients at the indicated time points determined by paired one-way ANOVA with Tukey’s post-test, *p<0.05. Principal coordinate analysis of weighted and unweighted UniFrac distances colored according to time points in C–D) healthy controls and MS patients. E) Average individual UniFrac distances calculated per subject assessed by paired one-way ANOVA with Tukey’s post-test, *p<0.05; **p<0.01; #p<0.1.

