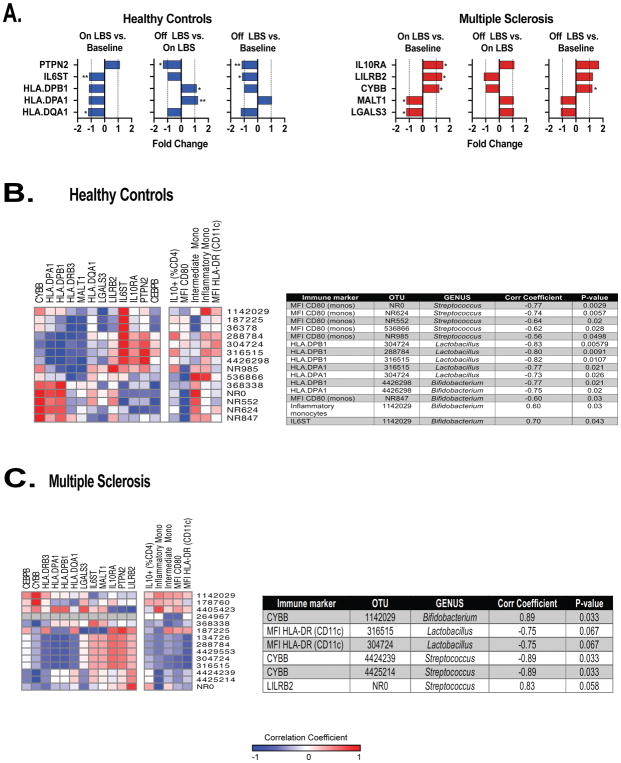
Figure 6. LBS effect on gene expression profile in peripheral monocytes.
A) Gene expression was measured in circulating monocytes using the Nanostring Immunology panel array at the indicated time points in healthy controls (n=9) and MS patients (n=7) assessed by Wilcoxon signed rank test, *p<0.05; **p<0.01. Spearman’s correlation between immune markers and operational taxonomic units (OTUs) relative abundance following LBS supplementation in B–C) healthy controls and MS patients. OTU = Operational taxonomic unit; NR = New Reference; Mono/monos = Monocytes; MFI = Mean fluorescence intensity; Corr coefficient = Correlation coefficient.

