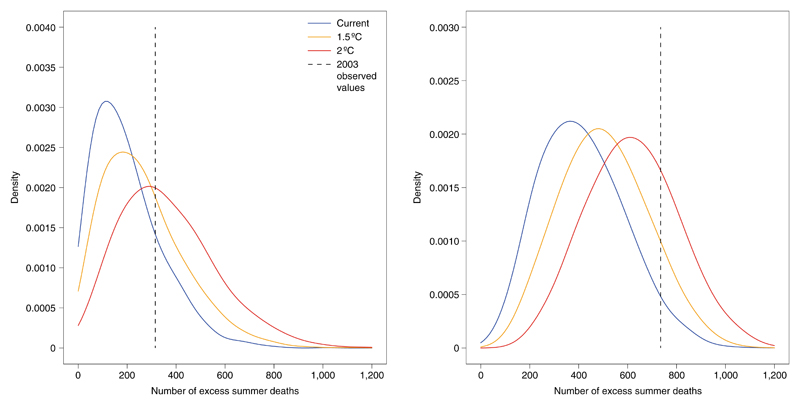
Fig. 1. Distributions of heat-related summer mortality in current, 1.5 °C and 2 °C decade experiments.
Cumulative summer mortality in London (left) and Paris (right) using a method from an earlier study5 applied to the HAPPI data. The full distributions of data for all years of all ensemble members of all models are shown in each case. The legend applies to both panels.

