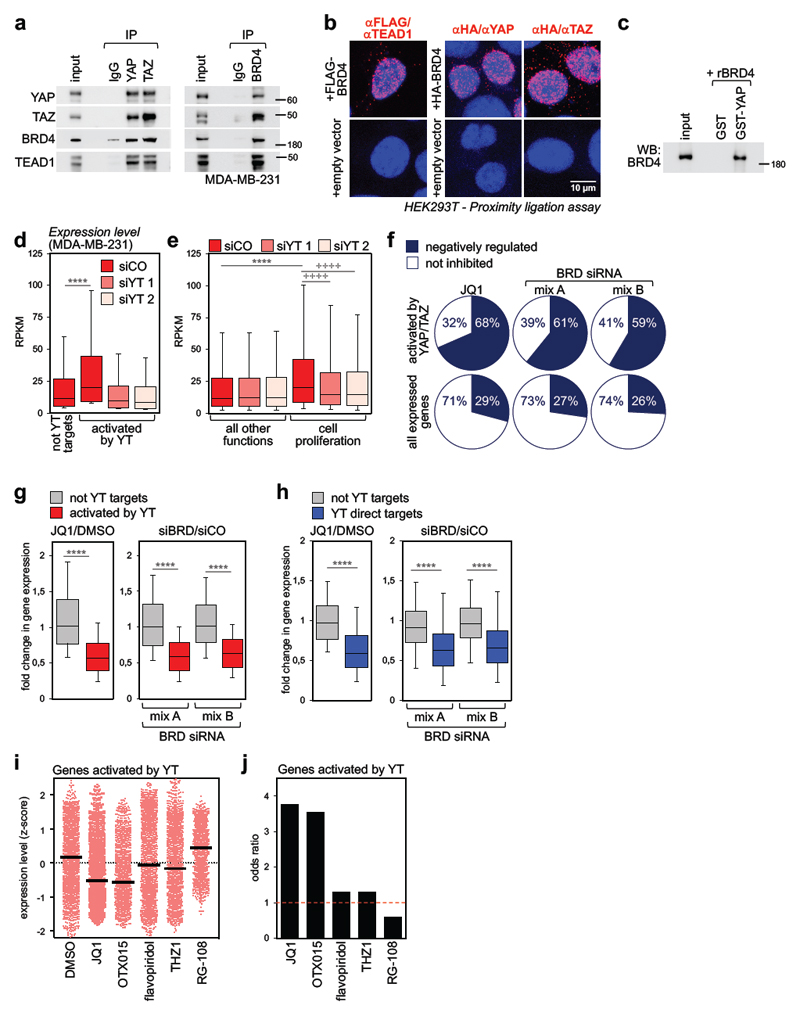
Figure 1. BRD4 associates to YAP/TAZ and is a required cofactor for YAP/TAZ transcriptional activity.
a) Interaction of endogenous YAP/TAZ, TEAD1 and BRD4 in MDA-MB-231 cells. Each co-IP experiment was performed three times with similar results.
b) Endogenous YAP, TAZ or TEAD1 and exogenous FLAG- or HA-BRD4 interact in the nuclei of HEK293T cells, as shown by PLA signal (red fluorescent dots). Nuclei are counterstained with DAPI (blue). No dots could be detected in the nuclei of cells transfected with empty vector, confirming the specificity of interactions. Similar results were obtained in two additional experiments.
c) Recombinant BRD4 is pulled-down by GST-YAP fusion protein. GST-pulldown was repeated three times with similar results.
d) Genes activated by YAP/TAZ (n=2073) display higher expression levels compared to genes not activated by YAP/TAZ (not YT targets, n=8026) in MDA-MB-231 cells. Expression values (in RPKM) were determined by RNA-seq and are presented as box-and-whiskers plots (whiskers extend from the 10th to the 90th percentile; the box extends from the 25th to the 75th percentile; the line within the box represents the median). **** p<10-10 (one-tailed Mann-Whitney U test). See also Supplementary Fig. 1g.
e) Box-and-whiskers plots of expression values of genes involved in cell proliferation (n=1449) vs. genes associated to all other functions (n=8650) according to GO annotation. Data are presented as in d. **** p<10-10 (one-tailed Mann-Whitney U test); ++++ p<10-10 (one-tailed Wilcoxon matched-pairs signed rank test)
f) The fraction of genes activated by YAP/TAZ which are inhibited by JQ1 or BRD2/3/4 siRNAs is larger than the fraction of all expressed genes downregulated by the same treatments. See also Supplementary Fig. 1i.
g) Fold change in gene expression of not-YAP/TAZ targets (n=8026) vs. genes activated by YAP/TAZ (n=2073) upon treatment with JQ1 (left) or BET proteins depletion (right). The y axis shows the fold change in transcript levels versus DMSO-treated cells or cells transfected with control siRNA. Data are presented as box-and-whiskers plots, as in d. **** p<10-10 (one-tailed Mann-Whitney U test)
h) Fold change in gene expression of high-confidence YAP/TAZ direct targets (n=616) vs. not-YAP/TAZ targets (n=771) upon treatment with JQ1 (left) or BET proteins depletion (right). The group of not YT targets represents genes not significantly affected by YAP/TAZ depletion (FDR>0.05) in our RNA-seq dataset. Data are presented as box-and-whiskers plots, as in d. **** p<10-10 (one-tailed Mann-Whitney U test)
i) Expression level of all YAP/TAZ activated genes (n=2073) in MDA-MB-231 cells treated with DMSO (vehicle), BET inhibitors (JQ1, OTX015), CDKs inhibitors (flavopiridol, THZ1) or RG-108 (a DNA methyltransferase inhibitor, here used as negative control to assess the effect of a compound targeting an epigenetic function not related to transcription). Expression levels were determined by RNA-seq and are presented as z-scores. Individual genes and their mean (black line) are presented.
j) Odds ratio plot: genes activated by YAP/TAZ (n=2073) are more likely to be inhibited by BET inhibitors than not-YAP/TAZ target genes. CDK inhibitors and RG-108 do not display such property (see Methods).

