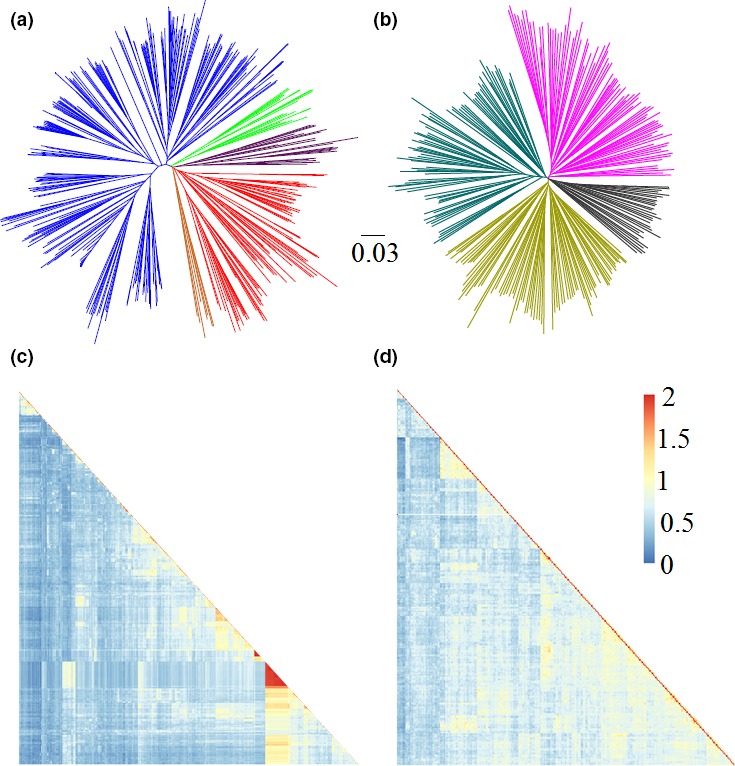
Figure 2.

Population structures and kinship heat map of two subsets of soya bean PIs and improved lines. (a) NJ tree of soya bean improved lines. The five subgroups identified from the tree are colour‐coded. (b) NJ tree of soya bean PIs. The four subgroups identified from the NJ tree are colour‐coded. (c) A heatmap of the kinship value among accessions of the improved lines. (d) A heatmap of the kinship value among accessions of PIs.
