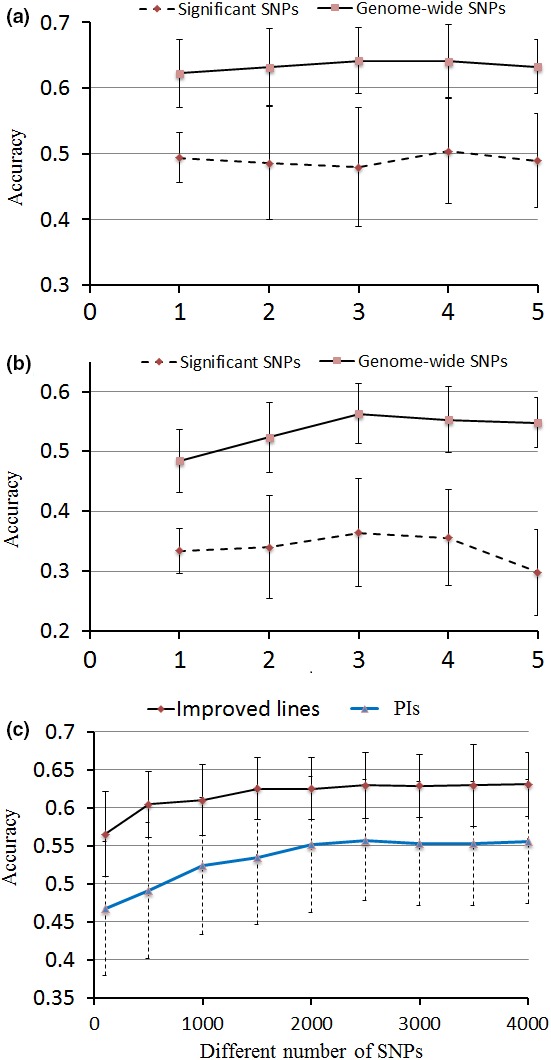
Figure 4.

Mean accuracies of cross‐validation for prediction of DSI in two panels of soya bean germplasm. (a) Comparison of prediction accuracy of different fold between GS and MAS in improved lines (b) Comparison of prediction accuracy of different fold between GS and MAS in PIs. (c) Prediction accuracy with different number of SNP markers in GS for DSI. The prediction accuracy was the mean of fivefold estimated from fivefold cross‐validation with 100 replications within each fold.
