
Figure 1.
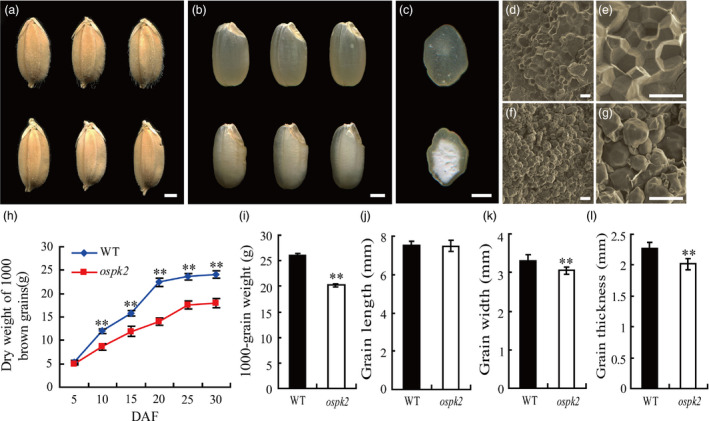
Phenotype of the ospk2 mutant. (a–b) Appearance comparison of seeds (a) and brown rice (b) of wild‐type (WT) (above) and ospk2 (below). (c) Transverse sections of WT (above) and ospk2 (below) brown rice. (d–g) Scanning electron microscopy images of transverse sections of the WT (d, e) and ospk2 mutant (f, g) grains. Scale bars, 1 mm in (a–c); 20 μm in (d, f) and 50 μm in (e, g). (h) Weight of dry grains of WT and ospk2 at various stages of grain filling. DAF, days after fertilization. (i–l) Weight of 1000‐grains (i), grain length (j), grain width (k) and grain thickness (l) of WT and ospk2. Data in (h–l) are means ± SD from three biological replicates, and each replication in (i) and (h, j–l) not less than 200 and 50 seeds, respectively. Asterisks in (i–l) indicate statistical significance between the WT and the mutant, as determined by a Student's t‐test (**P < 0.01).