Figure 2.

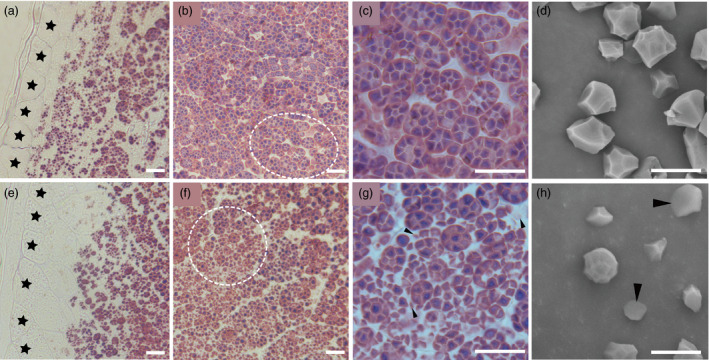
Starch granules formation in endosperm cells. (a–c) Semithin sections of wild‐type endosperm at 10 days after fertilization (DAF). (d) SEM analysis of starch or insoluble glucan granules purified from mature kernels of the wild‐type. (e–g) Semithin sections of ospk2 mutant endosperm at 10 DAF. (h) SEM analysis of starch or insoluble glucan granules purified from mature kernels of ospk2. (a, e) represent the peripheral region of endosperm of wild‐type and ospk2 mutant, respectively; (b, c) represent the central region of endosperm of wild‐type; (f, g) represent the central region of endosperm ospk2 mutant; (c, g) are enlarged sections of the white circle region from (b) and (f), respectively. Stars in (a, e) indicate the aleurone layer cells. Arrowheads in (g) indicate smaller, weak staining or abnormal starch granules in cytosol of ospk2. Arrowheads in (h) represent smaller or irregular shapes starch granules in ospk2. Scale bars: 10 μm in (a–h).
