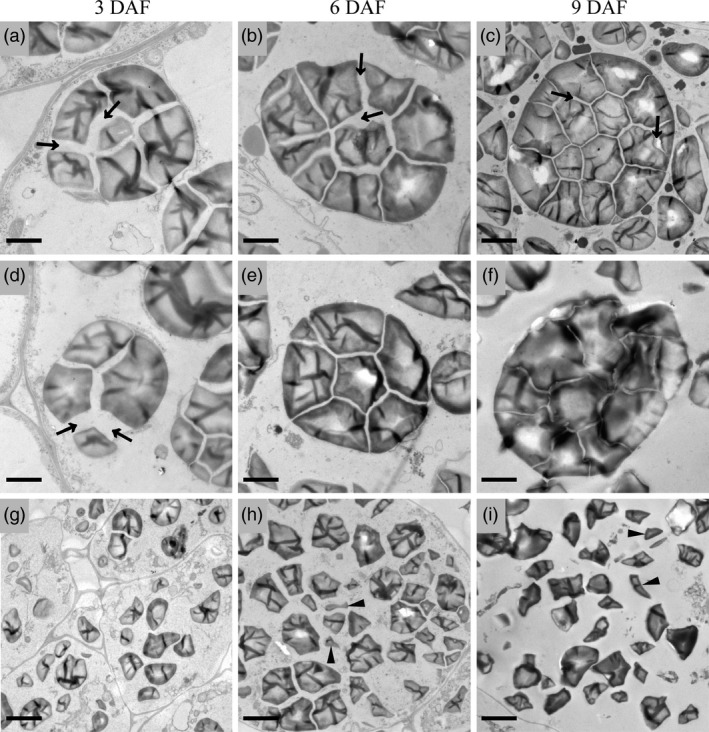
Figure 3.

Electron micrographs depicting amyloplast development in endosperm cells of wild‐type (a–c) and ospk2 (d–i). (a, d, g) display an amyloplast in endosperm cells of wild‐type and ospk2 at 3 days after fertilization (DAF). (b, e, h) Amyloplast in endosperm cells of wild‐type and ospk2 at 6 DAF. (c, f, i) Amyloplast in endosperm cells of wild‐type and ospk2 at 9 DAF. (d–f) Represent few well‐developed amyloplasts in the endosperm cells of ospk2 mutant. (g–i) Represent the majority phenomenon of starch granules in ospk2 endosperm cells. Arrowheads in (a–d) show the stroma inside the amyloplast. Arrowheads in (h, i) indicate smaller, irregular shape, abnormal granules in ospk2. Bars: 2 μm (a–f), 5 μm (g–i).
