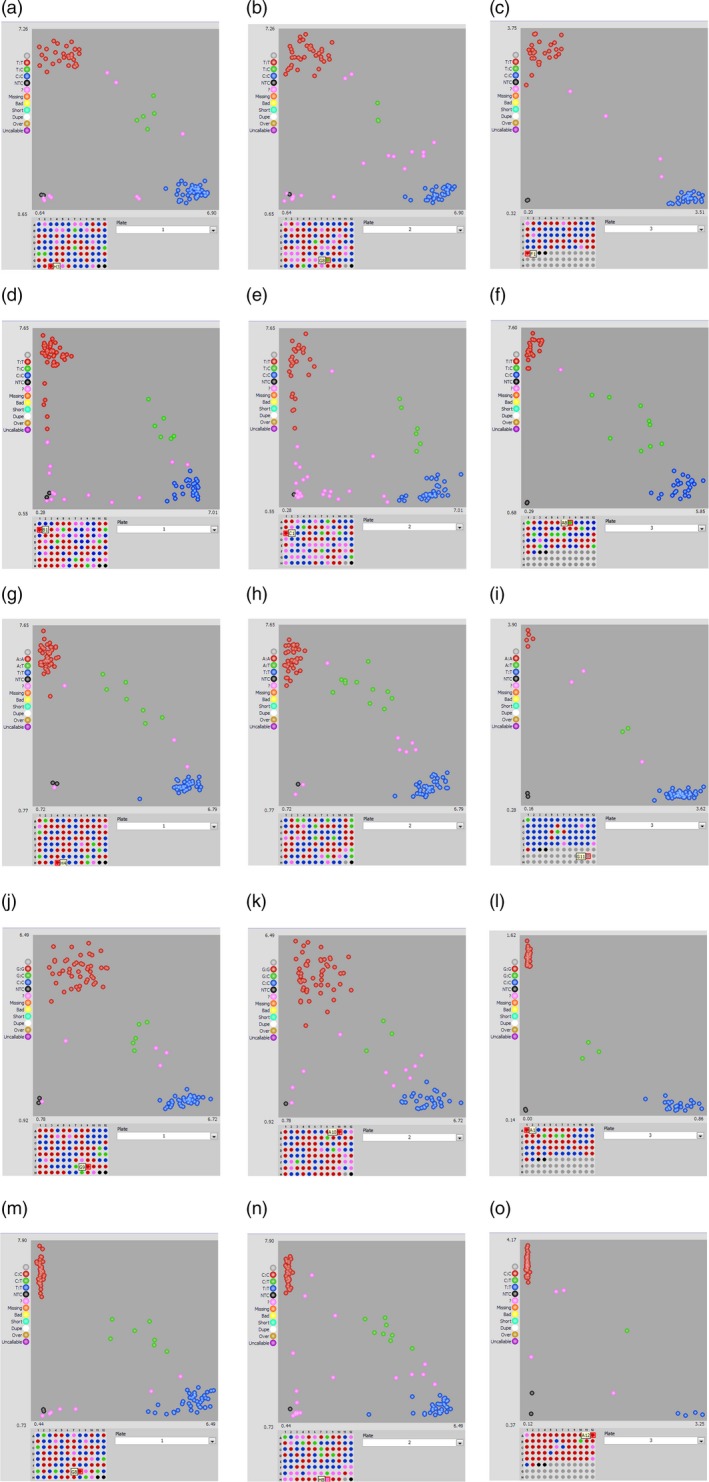
Figure 3.

Snapshot displaying SNP genotyping with KASP assays using markers flanking the major QTLs for ELS and LLS. Different scenarios of validation of major QTL flanking SNPs B05_22527171 (a‐c) and A06_14301316 (d‐f) associated with ELS, A05_20406182 (g‐i), A03_134198144 (j‐l) and A05_82270000 (m‐o) associated with LLS segregating in the RIL population. Marker genotyping data generated for each genotype were viewed using the SNPviewer software (LGC Genomics). The scatter plot along x and y axes represents allelic discrimination for a particular marker in the examined population. Red and blue clusters represent the homozygous alleles showing polymorphism.
