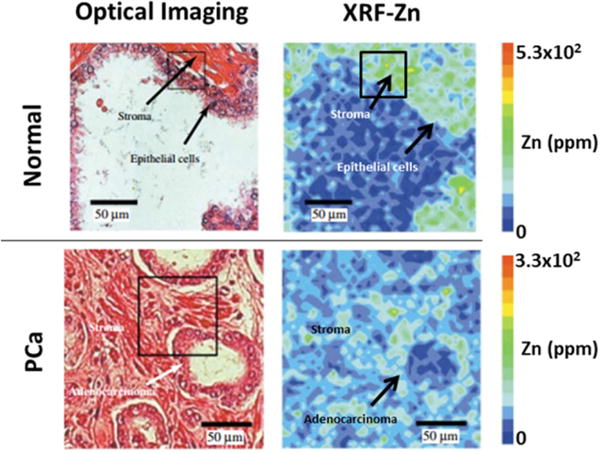
Figure 3.

XRF imaging of the tissue distribution of zinc in normal and PCa tissues. Optical imaging (left) shows the tissue morphology measurement area by hematoxylin and eosin stainning (H/E) between normal and PCa tissues. XRF imaging of zinc (right) with color scale of 0–5.3 × 10² ppm (top) and 0–3.3 × 10² ppm (bottom). Reproduced with permission from Wiley-Liss, Inc. [35]
